Abstract
1. Introduction
2. Variation in morbidity from infectious disease
3. Effects of infection on energy status3.1. Anorexia
3.2. Decreased dietary thermogenesis
3.3. Cultural and therapeutic practices
3.4. Malabsorption
3.5. Metabolic effects
3.6. Fever
3.7. Additional intestinal loss
3.8. Anabolic responses during infection
3.9. Reduced growth and weight loss4. Reduced activity
5. Energy requirements for recovery from infection
6. Anabolic response
References
Discussion (summarized by B. Schürch)
N.S. SCRIMSHAW *
* Massachusetts Institute of
Technology, Cambridge, MA, and Food, Nutrition and Development Programme, United Nations
University, Tokyo, Japan.
The adverse effects of communicable disease on energy status result from decreased intakes due to anorexia and the tendance to withdraw solid foods, from decreased absorption when the gastrointestinal tract is affected, from increased metabolism due to fever, from increased catabolic losses due to the stress response, and from diversion of energy for the internal synthesis of globulins and other proteins in response to infection. Among underprivileged children in most developing countries, episodes of infectious disease are frequent, and their cumulative effects contribute significantly to impaired growth and development. Energy requirements for recovery, including catch-up growth, are accordingly increased, but they are spread over a longer period of time. Under developing country conditions there is a risk that the diet will be inadequate for rapid recovery, and that another infection will occur before recovery is complete.
It is well known that infections, no matter how mild, affect both energy intakes and energy requirements through a number of mechanisms (SCRIMSHAW, TAYLOR and GORDON, 1968). In developing countries the presence of an infection is more likely than lack of available food to be responsible for undernutrition. This is equally true in a hospital situation in the United States. In both, however, the quantity and quality of food available to the individual is likely to be the limiting factor during the recovery period. At this time there is a period of increased appetite, and recovery is rapid if the diet is adequate.
The problem in generalizing about the magnitude of the effect of infection on energy requirements is that it depends on the nature, duration and severity of the infection for which the estimate is made. Moreover, for young children in developing country populations, it is not the effect of a single episode that is significant, but the pattern of frequent infections without full recovery between episodes. The failure to recover may be due either to an insufficient diet or to a new infection closely following the previous illness. The issue is complicated by the fact that a poorly nourished child is more likely to have frequent infections and to become still more malnourished as a result. Moreover, the same social and environmental circumstances that make malnutrition likely also increase the probability of frequent exposure to infection.
As summarized in Table 1, the potential effects of infection on energy requirements are variable and complex. Fever associated with an infection would increase energy expenditure while reduced physical activity would decrease it. Anecdotally and by personal observation, this does occur although quantitative documentation is lacking. In addition, even infections that are not associated with fever result in decreased food intake. They also cause a catabolic response that is particularly significant for protein requirements and contributes to energy depletion through this mechanism.
Table 1. Potential effects of infection on energy status
Mechanism |
Relative magnitude |
|
Decreased intake: |
||
Anorexia |
+ + |
|
Altered
diet |
+ |
|
Decreased absorption: |
||
Acute
diarrhea |
+ |
|
Tropical
jejunitis |
+ |
|
Intestinal
parasites |
0 or + |
|
Increased requirements: |
||
Greater
protein catabolism |
+ |
|
Protein-losing
enteropathy |
+ |
|
Fever |
+, + + |
|
Internal
synthesis |
+ |
|
Decreased requirements: |
||
Reduced
activity |
-, - - |
|
Reduced
growth |
- |
|
Less
diet-induced thermogenesis |
± |
|
The challenge is to move beyond
these conceptual and qualitative statements, to give some idea of the magnitude of the
effect of infection on energy requirements under various conditions. Because the nature
and circumstances surrounding each infectious episode are different, the relative
significance of these effects and their cumulative impact on energy requirements will vary
greatly.
It is an epidemiological truism that disease morbidity varies with time, place, and person. All this means is that in some places infections may be highly prevalent and in others less so. Even within the same place, overall morbidity and the kinds of infections responsible change over time. Finally, there is great variability among individuals, even at the same time and place. The first step is to identify representative burdens of morbidity as a basis for estimating the effect of infection under any given set of circumstances.
Figures 1 to 3 from Guatemala (MATA, 1978), Mexico (CHAVEZ and MARTINEZ, 1982), and The Gambia (ECCLES et al., 1989), respectively, illustrate the high frequency of infections in young children under village conditions in developing countries. Table 2 provides evidence for the frequency of infections among infants in The Gambia. Each episode of infection is associated with adverse nutritional consequences ranging from mild to severe.
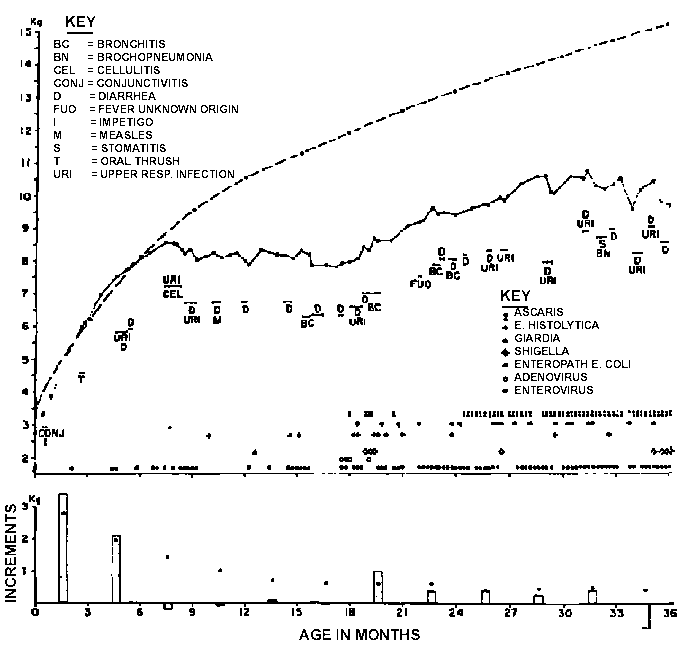
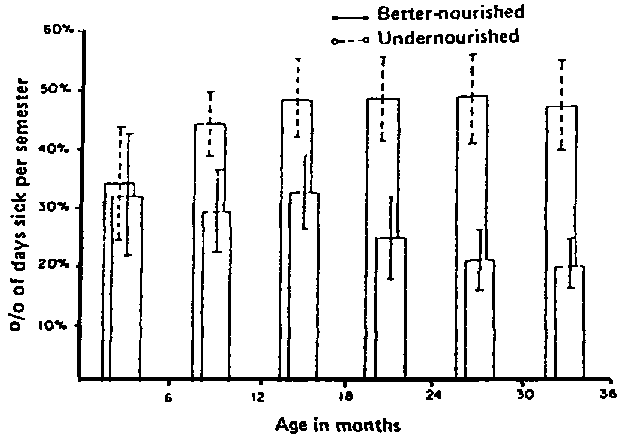
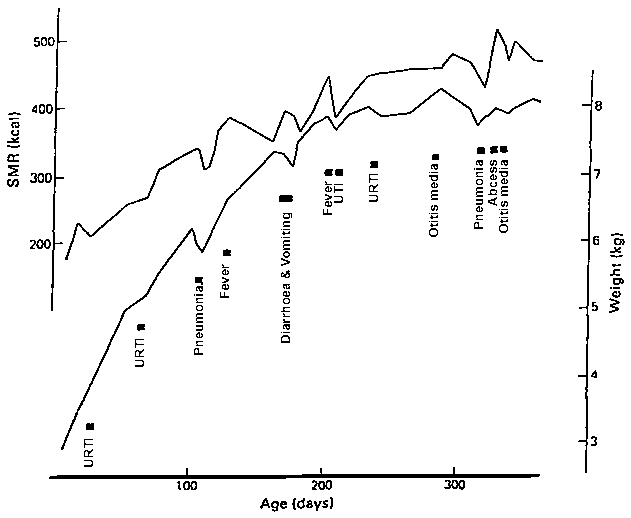
Table 2. Number of episodes of each illness and the number of days involved for 7 infants in rural Gambia
Illness (episodes/d) |
Infant |
||||||
1 |
2 |
3 |
4 |
5 |
6 |
7 |
|
URTI + |
6/31 |
1/3 |
6/29 |
1/6 |
3/24 |
2/11 |
3/24 |
Tonsilitis |
1/5 |
- |
1/6 |
- |
2/7 |
- |
- |
Otitis media |
2/11 |
8/50 |
2/8 |
- |
2/11 |
6/35 |
1/5 |
Pneumonia |
2/9 |
- |
- |
- |
2/9 |
- |
1/3 |
Diarrhea * |
3/17 |
2/18 |
7/39 |
1/7 |
- |
2/17 |
1/12 |
Diarrhea & vomiting * |
- |
1/4 |
1/11 |
1/4 |
1/5 |
1/16 |
1/5 |
Vomiting * |
- |
- |
- |
- |
- |
- |
1/6 |
Malaria |
1/3 |
- |
1/3 |
- |
- |
- |
- |
Abscess |
1/6 |
- |
- |
- |
1/7 |
- |
- |
UTI + |
- |
- |
- |
- |
1/6 |
- |
- |
Fever |
2/9 |
- |
3/17 |
1/7 |
4/17 |
1/5 |
- |
All illnesses |
18/91 |
12/75 |
21/113 |
4/24 |
16/86 |
12/84 |
8/55 |
URTI = Upper respiratory tract infection; UTI = Urinary tract infection+
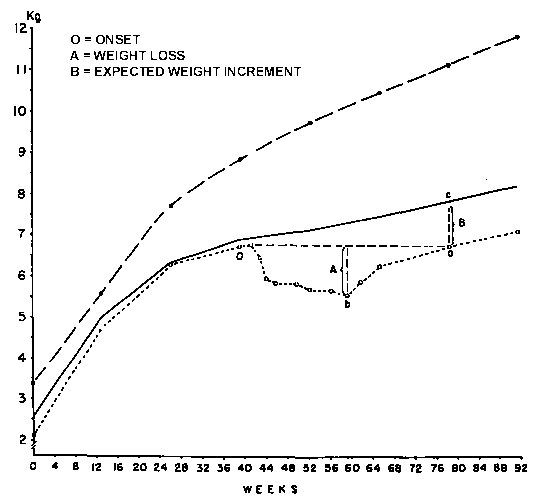
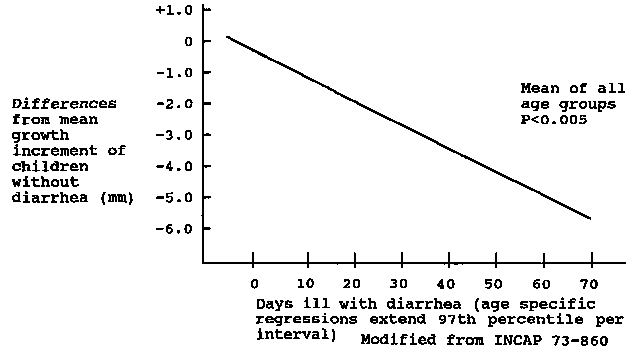
Table 3 shows that children in Guatemala who have had measles in preceding weeks have a marked loss of lean body mass compared with children in the same village who did not experience this disease (INCAP, unpublished data). Figure 4 illustrates the devastating effect of whooping cough in a poorly nourished Guatemalan who required 26 weeks after onset of the disease for her weight to return to that before the onset, leaving the child further retarded in weight for age (MATA, 1978). Table 4 shows that, of 44 cases of whooping cough in his village, 25% of the children required more than 25 weeks to regain initial weight, and only one-third recovered in 8 weeks or less. The effect of diarrheal infections on weight gain is shown in Figure 5 (MARTORELL et al., 1975). The degree of deficit in growth increment is proportional to the number of days ill with diarrhea in children 0- to 7-years-old.
Table 3. Effect of measles on CHI index in children in Guatemalan village compared with children with kwashiorkor from the region
Village children |
.90-1.00 |
Children with recent measles |
.70-.80 |
Kwashiorkor |
.60 -.70 |
CHI = Creatine per cm ht (unpublished INCAP data)
Table 4. Time required to recover the weight lost from a single episode of whooping cough
Weeks |
N |
% |
0-4 |
6 |
14 |
5-8 |
8 |
18 |
9-12 |
8 |
18 |
13-16 |
4 |
9 |
17-24 |
7 |
16 |
25 + |
11 |
25 |
Total |
44 |
100 |
(INCAP, 1968)
In most developing country populations, the close relationships among poverty, malnutrition, poor sanitation and hygiene, and the high prevalence of infections act synergistically to increase the risk of malnutrition and growth failure.
While infectious disease prevalence rates are high under village conditions in developing countries, they are even higher when children are brought together in institutions. Table 5 lists 108 infectious episodes among 34 children in a model convalescent home in Guatemala City with good sanitation and ample room (VITERI, personal communication). Table 6 records 136 episodes among 60 children in a 6-month feeding study in an orphanage in Vellore, India (PEREIRA, personal communication). These are only examples of a universal phenomenon. In addition, children in nurseries, even in industrialized countries, are susceptible to epidemics of a single infection.
Table 5. Acute infections among 32 children aged 2 to 9 years observed in a 'model' convalescent home in Guatemala City for 90 days
Diseases |
Total No. episodes |
Diseases |
Total No. episodes |
Infectious hepatitis |
2 |
Gonococcal vaginitis |
11 |
Measles |
2 |
Purulent otitis media |
4 |
Bronchopneumonia |
3 |
Acute tonsillitis |
7 |
Bronchial asthma and asthmatic bronchitis |
15 |
Upper respiratory tract infection |
15 |
Gastroenteritis |
5 |
Fever of unknown origin |
9 |
Amebiasis |
9 |
Urinary infection |
1 |
Parotitis |
4 |
Impetigo and cellulitis |
13 |
Chickenpox |
3 |
Skin allergy |
5 |
Table 6. Illnesses among 60 children aged 2 to 9 years in a 6-month orphanage feeding study in Vellore, South India
Respiratory infections |
43 |
Fever |
24 |
Diarrhea/dysentery |
14 |
Skin infection |
47 |
Jaundice |
4 |
Conjunctivitis |
1 |
Gingivitis |
3 |
Total |
136 |
(PEREIRA, personal communication)