3.1. Anorexia
3.2. Decreased dietary thermogenesis
3.3. Cultural and therapeutic practices
3.4. Malabsorption
3.5. Metabolic effects
3.6. Fever
3.7. Additional intestinal loss
3.8. Anabolic responses during infection
3.9. Reduced growth and weight loss
One constant result of infection is a loss of appetite that leads to a spontaneous decrease in dietary energy intake. Figure 6, taken from a study of BEISEL et al. (1977), shows that more than one-third of the negative nitrogen balance associated with an episode of Q-fever in a young male volunteer was due to a reduced food intake because of anorexia, and the remainder to a catabolic response.
INCAP studies of the effect of yellow fever vaccine on young children showed no febrile response, but all efforts to coax the children to eat as much of the formula diet in the days immediately after immunization as they had eaten before were unsuccessful (GANDRA and SCRIMSHAW, 1961). In the case of young children with diarrhea, fever or other signs or symptoms of infection, there is a strong tendency for the mother to withdraw solid food and substitute a watery gruel. Under all of these circumstances protein intake is usually proportionately reduced more than that of energy, but both are affected. This practice is highly variable, so it is a confounding factor that affects any estimate of the nutritional effects of infection.
The negative correlations of infections with caloric intake in the studies of MATA et al. (1971) are shown in Table 7. MARTORELL et al. (1983) described the lower home dietary energy intake of children with selected common infections compared to that of healthy children (Figure 7). In studies in Bangladesh (Table 8), caloric intakes of infants with diarrhea were more than 40% lower than in those without (HOYLE et al., 1980). The cause of the diarrhea strongly influenced the magnitude of the loss. Rotavirus and enteropathogenic E. coli (EFTC) infections produced the greatest effect, both in the acute stage of the illness and during recovery (Table 9).
Table 7. Correlations of calorie intake and morbidity in 30 weaned children in Santa Maria, Guatemala
Infection |
Correlation |
P value |
All infections 2 yrs |
-.40 |
.02 |
Respiratory 2nd yr |
-.42 |
.01 |
Diarrheal 2nd yr |
-.38 |
.02 |
Respiratory 2nd yr |
-.42 |
.02 |
Diarrhea all 3 yrs |
-.40 |
.03 |
All other comparisons negative, not statistically significant.
(MATA et al, 1977)

Table 8. Total calorie intake (kcal/kg/24h) from breast milk, oral fluids, and weaning foods among children with diarrhea and healthy controls (Mean ±SEM) in Bangladesh
Source of calories |
Healthy controls (11) * |
Children with diarrhea (15) * |
Breast milk |
53.6 ±6.7 |
46.9 ±5.5 |
Oral fluids |
- |
10.1 ±2.0 |
Weaning foods |
86.3 ±21.1 |
33.3 ±8.8 |
Total calories |
129.9 ±16.8 |
75.0 ±8.3 |
* Figures in parentheses indicate the number of subjects studied. (HOYLE et al. 1980)
Table 9. Intake of calories in acute stage (A), 2 weeks (R.) and 8 weeks (R2) after recovery (Mean ±SD) in Bangladesh
Aetiologies |
A |
R1 |
R2 |
Cholera |
74.9 ±36.2 |
111.1 ±35.4 |
109.59 ±31.7 |
Rotavirus |
68.5 ±22.6 |
87.2 ±26.2 |
115.0 ±20.2 |
ETEC |
70.7 ±37.9 |
90.97 ±28.4 |
114.9 ±19.0 |
Shigella |
70.0 ±28.2 |
100.5 ±27.8 |
109.3 ±18.8 |
(MOLLA et al, 1983)
The thermal effect of various foods
on metabolism is well established and depends on the composition of the diet. The highest
rate values are associated with dietary protein, followed by carbohydrates and lowest fat.
A decrease in food intake would obviously result in lower dietary thermogenesis.
Withdrawal of solid food from individuals with fever, diarrhea, or other symptoms of infection is an almost universal practice that results in decreased caloric intake. While consumption of food is also reduced by anorexia, the purposeful withholding of food has a significant impact.
Moreover, the food offered is likely to be gruels and beverages of low caloric density. For example, in Guatemala, children with measles are frequently given tea (agua de tisana) made from a local wild plant.
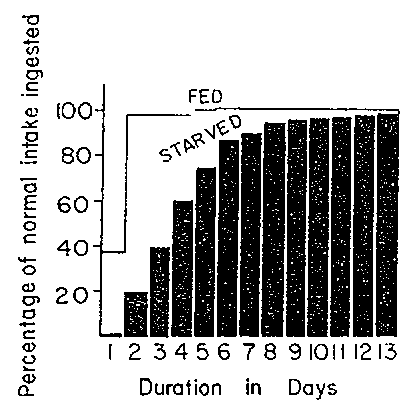
Many years ago, CHUNG and VISCOROVA (1948) showed that the common practice of withholding food from children with diarrhea adversely affected their recovery. Figure 8 shows the difference in intake by children with diarrhea who were not fed during illness and experimentally those given a good diet. Although the children given food had an increased stool volume, they also absorbed more dietary energy and protein and recovered sooner. Many similar studies have followed, and it is now strongly recommended that food not be withdrawn during diarrhea and other infections.
In the studies of CHUNG and VISCOROVA (1948), absorption of nitrogen in 4 children with diarrhea varied from 40 to 74% and fat absorption from 39 to 67% when caloric intake was moderate to high. Data from ICDDRB on patients with diarrhea caused by a rotavirus indicate an average nitrogen absorption of 43%, 42% fat absorption, 48% carbohydrate absorption, and 55% intestinal absorption of total energy. The corresponding figures for absorption by patients with diarrhea due to enterotoxigenic E. coli and Shigella were slightly lower (MOLLA et al., 1982).
A wide range of infections are associated with malabsorption and most are common in developing countries. They include the bacterial, viral and protozoan enteritides, intestinal parasites such as hookworm, fish tapeworm, ascaris and strongyloides, and systemic diseases such as measles, tuberculosis, malaria, and streptococcal infections. These infections shorten intestinal transit time by physical blocking of the mucosal surface or by reducing mesenteric blood flow.
A certain proportion of children with acute diarrhea! disease of nonspecific cause have persistent carbohydrate intolerance and undergo a much more severe and prolonged nutritional deficit. WALTER (personal communication) showed in Chile that in children recovering from severe malnutrition, malabsorption of fat and carbohydrate persisted for 4 to 6 months after apparently complete recovery from malnutrition.
In addition, between 30 and 50% of
individuals living in an unsanitary environment experience so-called tropical jejunitis
that causes chronic changes in the intestinal epithelium including flattening of the villi
and loss of microvilli (ROSENBERG and SCRIMSHAW, 1972). The malabsorption resulting from
tropical jejunitis attracted considerable attention when it was identified in returning
U.S. Peace Corps volunteers who had lived in unsanitary environments, and they required up
to a year for full recovery of intestinal integrity. This phenomenon has been reported
from India, Thailand, Bangladesh, Colombia, and Pakistan and occurs in most developing
countries. SCHNEIDER et al. (1978) at INCAP showed that most rural Guatemalans in
which they measured absorption directly had slightly but significantly reduced absorption
of protein, fat and carbohydrate.
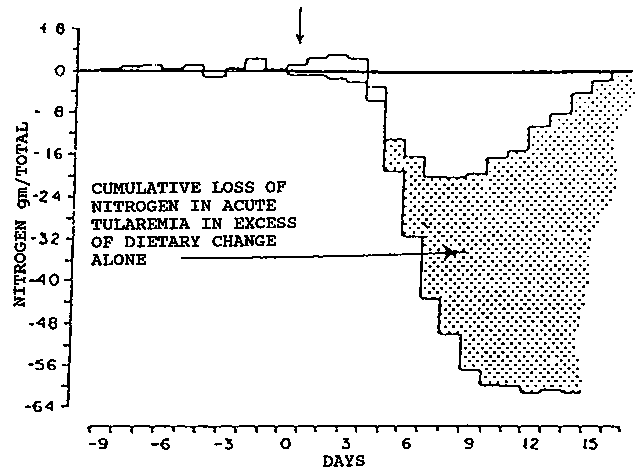
A catabolic response occurs with all infections, even when they are subclinical, i.e., not accompanied by symptoms (SCRIMSHAW, 1977). Under the stimulus of the release of interleukin-2, endocrine changes are initiated that lead to the mobilization of amino acids from the periphery, primarily from skeletal muscle, and their transport to the liver where they are used for gluconeogenesis. The unused nitrogen is excreted as urea.
Figure 9 shows the metabolic response of an individual with completely asymptomatic Q fever, whose nitrogen balance nevertheless became negative, with a progressive increase in cumulative nitrogen deficit over a period of 21 days (BEISEL, 1975). At INCAP, experience with metabolic studies in children's infections, with the exception of uncomplicated upper respiratory infections, always showed a period of negative nitrogen balance. This was true not only for the common communicable disease of childhood, e.g., lower respiratory tract infections, diarrheas and dysenteries, but also for pyogenic skin infections and measles vaccine. It even followed immunization with yellow fever vaccine not associated with fever or other symptoms (GANDRA and SCRIMSHAW, 1961).

The energy cost of synthesizing a gram of protein is about 4 kcal, or 6 kcal per g of total weight gain (UNU, 1979). Extrapolating energy loss from nitrogen loss leads to the conclusion that this loss could amount to between 4 and 5 kcal per kg per day.
Another approach to determining the
magnitude of the catabolic response to an infection is to quantify urinary
3-methylhistidine as a measure of muscle protein catabolism. LONG et al. (1977)
have reported an increase of 12 to 30 mg per day during the peak fever response. The total
N increase in the urine was the equivalent of 1.14 g of protein kg/d, or about 7
kcal/kg/d.
Whatever its contribution to resistance to infection may be, fever has a metabolic cost (KLUGER, 1989). The regulation of normal body temperature within a narrow range is a complex phenomenon which is altered by the endogenous pyrogenic activity of interleukin-1 that is released by mononuclear leukocytes in response to infection. The resulting fever increases basal metabolic rate (BMR) by 13% for each 1 degree C (DUBOIS, 1937). In some extended infections such as pneumonia and typhoid fever, temperature is maintained at a high level with daily variations around this level that are similar to those in the normal range. Conversely, in malaria there are periodic rises and falls in temperature. During the period of maximum fever, metabolism may increase by nearly one-third.
Figure 10 taken from DUBOIS (1936) illustrates the relationship of BMR to temperature measured in a variety of infections. He decribes Van't Hoff's law that the coefficients for the increase in the velocity of various chemical reactions with temperature lie between 2 and 3. This means an increase of 30 to 60% for a 3 degree rise in temperature from 37 to 40 degrees C.

Since carbohydrate stores are inadequate to meet the increased energy requirement induced by both fever and the catabolic response to infection and since lipid stores are not effectively used in the infected patient, another source of energy is required (BEISEL and WANNEMACHER, 1980). This is mainly interleukin-1 releasing both insulin and glucagon from the endocrine pancreas, stimulating muscle breakdown with the release of precursor amino acids into the blood stream for gluconeogenesis. It should be emphasized that the process that leads to increased gluconeogenesis is not dependent on fever. However, the energy deficit is increased in proportion to the degree and duration of the fever.
In the Gambian study of ECCLES et al. (1989), sleeping metabolic rate (SMR) was measured repeatedly both during illness and when individuals were healthy. Table 10 shows a 6% increase in SMR with a 1 degree C increase in body temperature during infection, one-half of the DUBOIS figure, and 12.3% in well children, close to the DUBOIS figure of 13%. However, SMR fell significantly with fever and even more so with malaria. Nevertheless, SMR/kg increased 9% per episode and 1.9% when calculated for the entire year. The authors do not offer an explanation, but it may be because greater malnutrition in the infected children limited their metabolic response.
Table 10. Parameters having significant effect upon sleeping metabolic rate (SMR) and respiratory quotient (RQ) (all = well and ill values; well = well values only in The Gambia)
Variable |
unit of variable |
% change in SMR (+ /-) |
unit change in RQ (+/-) |
|
Weight |
(all) |
+1% |
+1.05** |
|
(well) |
+1% |
+0.94*** |
||
Fatness |
(all) |
+1% |
-0.16*** |
|
(well) |
+1% |
-0.18*** |
||
Body
temp. |
(all) |
+1°C |
+6.2*** |
-0.03* |
(well) |
+1°C |
+12.3*** |
-0.08* |
|
Age |
(well) |
+1 month |
+1.3* |
|
Malaria |
+1 d |
-17.4** |
||
Fever |
+1 d |
-6.6* |
||
Multiple regression analysis of the effect of different variables inserted in the order shown.
* p < 0.05
** p < 0.01
*** p < 0.001
(ECCLES, COLE and WHITEHEAD, 1989)
Protein-losing enteropathy is distinct from malabsorption. In ICDDRB studies, nearly two-thirds of patients with enterotoxigenic E. coli diarrhea (ETEC) and 40% of those with rotavirus diarrhea also had excessive loss of protein in their feces (MOLLA et al., 1983 a, b). They reported that the protein equivalent of 100 and 5000 mL of serum was lost in the feces each day in patients with shigellosis.
Bleeding into the intestine from
hookworm (FARID et al., 1965; ROCHE et al., 1957a, b) can also cause a loss
of calories. BRISCO (1979) has concluded that each adult hookworm causes the loss of about
1 kcal/d. Using an estimate of an average hookworm load of 100 hookworms in IDCCRB studies
in Bangladesh, this would amount to an average energy loss of 100 kcal/d, a very
significant loss for young children. Moreover, hookworm burdens greatly in excess of this
are common in tropical developing countries; even numbers in excess of 500 worms have been
described (CHIRIBOGA et al., 1950).
In the early metabolic studies at INCAP in children during episodes of infection, we were surprised by the much greater retention of nitrogen during the recovery period than could be accounted for by the cumulative negative balance that we measured during the catabolic period. While some of this may have been recovery from the underlying malnutrition on which the infection was superimposed, it was observed in children who had apparently recovered from malnutrition.
Figure 11 shows the marked increase in nitrogen retention in two 9-day periods immediately following chicken pox in 3 children in the last stages of convalescence from kwashiorkor. Although it is technically difficult to measure, I believe that the internal diversion of nutrients for the synthesis of compounds involved in the response to infection contributes importantly to the depletion of body stores during infections. These include the production of new cells for phagocytosis, cell-mediated immunity, antibody synthesis and repair of structural damage. Additional intracellular components required to combat infection include the nucleic acids, ribosomes, enzymes etc., and finally endogenous substance produced by cells such as immunoglobulins, interferon, complement fractions, hormones, acute phase glycoproteins, and endogenous mediators.

Figures 1 to 4 illustrate the impaired growth characteristic of children subject to frequent infections and borderline diets. The net result is a decrease in nutrient requirements, although the effect is less significant for energy than it is for protein. This is because the requirement for the average daily growth of a 2-year-old child is about 12% of the total protein requirement, and for energy about 2% of the total (3% of BMR). The relatively small saving in energy from stopping growth is generally not sufficient to avoid actual weight loss. Thus, weight loss is the almost inevitable consequence of malnutrition in marginally malnourished children.
The weight loss associated with a single episode of infection usually compromises organ and tissue function and the loss is easily made up if the diet is adequate to permit this. However, recurrent episodes without sufficient food or time for recovery account for most of the poor growth of young children in developing countries.
MARTORELL et al. (1975) have
analyzed the relationship between acute morbidity from diarrhea! disease and physical
growth increment in 718 Guatemalan children ranging from 15 days to 7 years of age. Figure
7 summarizes the finding that the more days ill with diarrhea, the greater the deficit
in child growth.
TORUN and VITERI (1981) observed the dietary intake and activity of a group of children fed ad libitum in a convalescent home with facilities for active play. When they lowered their food intake by 10%, the children promptly reduced their physical activity sufficiently to come into energy balance. With a 20% reduction in calories, growth was also affected.
Children who are sick spontaneously
decrease their activity and may be confined to bed. This represents a reduction in energy
requirement that carries no biological penalty over a limited period. The average
requirements are 1.1 x BMR for Lying down, 1.2 x BMR for sitting, 1.4 x BMR for standing
and 2.2 x BMR for walking or moving about. Assuming 4 hours of sitting and 2 hours of
standing instead of 6 hours of walking and other play activity, the energy savings of 15%
would help to compensate for some of the factors increasing requirements.
There seems to be a metabolic window during recovery in which appetite is increased and the rate of retention, at least for protein, may be as much as eight times the average daily requirement. What generally happens in infants and young children in developing countries, however, is that the diet is too marginal to permit repletion before another episode of infection depletes the child further.
Table 9 shows the large increase in caloric intake 2 and 8 weeks after recovery from diarrhea from various causes in Bangladesh children compared with their intakes during the acute stage (MOLLA et al., 1983). In this case, food was freely available. The children's preinfection dietary intake was unknown.
A UNU (1976) publication gives the energy cost of synthesizing a gram of lost protein as 7.5 kcal per gram and 11.6 kcal for replacing a gram of fat. JACKSON (1977) in Jamaica measured the energy cost of catch-up growth in children recovering from protein-energy malnutrition and found a range of 4 to 5 kcal per gram of weight gain, with 40% of this considered to be fat tissue and 60% lean body mass tissue. Elsewhere in this volume JACKSON (1990) presents evidence that the proportion of fat and protein gained is influenced by the protein/energy ratio. The authors of a UNU (1976) publication calculated that, under conditions prevailing in developing countries, a malnourished one-year-old child depleted by an infectious episode of 7 days' duration would need approximately 136 kcal/kg/d and 2.56 grams of protein/kg/d for repletion in 30 days. It should be noted that the same weight deficit without infection would have required less than one-third the amount of protein per kg/d, but approximately the same number of calories.
In a recent INCAP study,
supplementation completely offset the negative effect of diarrhea! disease on the length
of the infant, attesting to the importance of an adequate diet during the recovery period
(LUTTER et al., 1989).
The severity of the caloric deficit is related to the duration and magnitude of the malabsorption and rarely poses a major threat to nutrition unless the deficit is chronic or recurrent. The net effect of the changes with infection that I have reviewed is to increase their need for both dietary protein and energy if satisfactory recovery is to be promoted. Is it possible to be more quantitative?
POWANDA (1977) has summarized data from a wide variety of acute infectious diseases by adding the total nitrogen losses and dividing them by the number of days over which these losses occurred. For all infections the average loss of 0.6 g of protein per kg per day is equal to the mean estimated protein requirement for adults. Diseases associated with diarrhea or dysentery produced an average loss of 0.9 g of protein per kg per day. Higher losses were observed with typhoid fever and other severe infections, reaching 1.2 g of protein per kg per day. If the energy cost of depositing a gram of protein is taken to be 25 kcal (100 kJ), these protein losses would deplete the infected individual by an average of 7 to nearly 30 kcal per kg of body weight (UNU, 1979). Elsewhere in this volume, JACKSON (1990) gives 4 kcal for the latter, but this figure must be corrected for only 90% utilization of dietary energy.
The difficulty with such calculations is that they do not include energy expended for the multiple anabolic responses to the infection. As emphasized earlier, balance studies during recovery indicate these to be substantial, although there are 'savings' of dietary energy during the acute phase of an infection that are due to anorexia. This loss must be made up during the recovery period in addition to the losses due to the deficits arising from malabsorption and that due to infection-stimulated catabolism. Thus, with each infectious episode there is a small decrease in de facto requirement at the time of the infection and a modest increase in energy requirement during the convalescent period. The more severe and closely spaced the episodes of infection, the more likely that full recovery will not occur and that the adverse effects will become cumulative.
Both metabolic and field observations suggest that, even with an optimum diet, it may take two to three times longer to replete than to deplete an individual. In this case, any figure for daily increment of additional energy during recovery only need to be from one-half to one-third of the daily loss during the acute phase of an infection. Of course, if the diet is not sufficient for a maximum rate of recovery, the increments available for recovery are correspondingly reduced and the time required for complete recovery greatly increased. Under developing country conditions there is then a high risk that another episode of infection will occur before recovery has taken place.