This is the old United Nations University website. Visit the new site at http://unu.edu
Introduction
Prediction models
Preference relations
Decision-making models and optimization analysis
Input-output analysis
Stochastic process models
Conclusion
References
MICHAEL C. ROBBINS and LINDA COFFMAN ROBBINS
Department of Anthropology, University of Missouri, Columbia,
Missouri, USA
The intrinsic value of a small-scale model is that it compensates for the renunciation of sensible dimensions by the acquisition of intelligible dimensions.
Levi-Strauss, The Savage Mind
The objective of this paper is to provide a non-rigorous overview of a few elementary mathematical models and analytic techniques that appear to have utility for furthering the goals of nutritional anthropology. Among these goals are recognizing and specifying the conditions under which regularities occur in how people conceptualize, procure, process, distribute, and use food, and the attendant consequences. As in any science, the aim of nutritional anthropology is to provide reliable and valid information in a form suitable for practical use. Striving to achieve these goals entails several operations (not always in this order): observation, concept formation, measurement, enumeration, comparison, classification, proposition formulation, verification, and extrapolation. And these in turn require, among other things, a precise language, logic, and calculus for: (a) defining relations between concepts and variables, and relations between these and empirical phenomena and substantive theory; (b) formulating and verifying propositions; and (c) deriving implications and extrapolations beyond the facts observed. We conjecture that mathematics can meet these needs, for it is simultaneously an abstract, yet precise, language, logic, and calculus for defining the relations among a set of elements. If correspondences between empirical phenomena or substantive theory and mathematical systems can be successfully established, then the full conceptual and analytic power of mathematics can be harnessed and put to use.
The process of mapping empirical data and substantive theory onto abstract, mathematical systems (or the converse) is known as "mathematical modelling." Mathematical models (like other kinds of models, such as toys, games, and maps) are abstract expressions or representations of part of the real world. They consist of statements about relationships among a set of variables. These statements normally take the form of a set of equations or rules for establishing identities among quantities. Like other models, they are designed to be observed, contemplated, manipulated, tested, and revised. As Hoffmann comments, "A calculus is an abstract mathematical structure, a model its interpretation within an empirical context" (1971, pp. 189-190).
The value of building a mathematical model is considerable. It provides a medium for precise description and a logic for reasoning through complex arguments and for examining the logical validity of statements. Also, a model greatly augments analytic power by enabling the decomposition and reduction of data to intelligible proportions and by allowing for complex, subtle, and extended derivations. A model serves to define problems concisely and to generate verifiable predictions and extrapolations in a way that makes practical implications more obvious. A model may also indicate significant gaps in data and measurements requisite to resolving certain problems, and provide direction for the collection of new kinds of data and the development of new kinds of measurement procedures. Moreover, a model facilitates the transfer of data, concepts, and patterns from one field to another by formalizing representations and descriptions of empirical phenomena and substantive theory at a level abstract enough to be integrated with models of similar phenomena in other disciplines, e.g. economics, physics, and biology.
At the outset we acknowledge that the scope and treatment of mathematical models in this chapter will be quite limited, for several reasons. First, we have tried to focus on models with rather obvious connections to both pure and applied research in nutritional anthropology, as is often indicated by their prior use. Second, as far as possible we want to avoid conjuring up artificial examples and to demonstrate the application of mathematical models to real data from actual research in the field. While the problems and data to which we have applied certain models are attenuated, we hope they will show how analysis can proceed and how analogous research concerns can be tackled. Third, our presentation is limited to modelling, for the most part, with pre-calculus mathematics. Because we have assumed little more than an elementary background in algebra and statistics, we have allocated considerable space for illustrating basic computational procedures. We forgo enunciating theorems, discussing proofs, and making extensive derivations. Finally, we should stress that we see our purpose as offering a smorgasbord of appetizers, prepared to convey some of the flavour of mathematical analysis, but not to be mistakenly consumed as a substitute for a more substantially nourishing main course. If we motivate a desire to explore the benefits of mathematics a little more than before, then we will have succeeded.
The models we have selected to describe are, in order: (a) prediction models, using explicit functions to infer the values of unknowns from the values of knowns; (b) preference relations for the analysis of the properties of relations in a set of elements to construct a preference order; (c) decision-making models for optimally allocating scarce means to alternative ends, with surrounding constraints; (d) input-output models for specifying the structure of relations of interdependence among a set of components conceived as an endogenous system and the relations of this system to exogenous environmental variables; and (e) stochastic process models for representing phenomena as a sequence of random outcomes that are governed probabilistically.
Simple Linear Functions and Equations
For scientific knowledge to be useful it must allow for both an understanding of past events and some prediction of unknown future events. A description of events alone cannot be used for purposes. Expectations must instead be generated from a logical system in which rules specifying the interrelationships among two or more variables are provided. In nutritional anthropology we find studies of the relationships between many pairs of variables, including socio-economic position and diet, socio-cultural and nutritional change, ethnic identity and food preferences, and nutritional deficiencies and mental and behavioural performance (cf. Haas and Harrison, 1977). The aim of these studies is to formulate regularities and predictions whereby the values of one or more variables (e.g. income) can be used to predict the values of another variable (e.g. protein intake). Mathematics, as a formal way of defining relationships among a set of elements, can be of considerable help in this regard.
One of the most important relations in mathematics is the explicit function in which the values of a dependent variable are said to be determined by, or inferred from, the values of one or more independent variables. The most common and most elementary function is the simple linear function, the rule of which is
(1) f(x)=a+bx
where f (x) = y (read: "the function of x is y") is the dependent variable whose range of numerical values is assumed to depend upon (be determined by, or inferred from) the permissible numerical values (domain) of x, the independent variable. The parameter a is a constant value of the dependent variable y when x = 0, and is called the y - intercept. The parameter b is a constant of proportionality, called the slope, which specifies the incremental change in the numerical value of y that occurs for any unit change in the numerical value of x. The rule of the explicit linear function described by equation (1) states that a value of y can be uniquely specified by adding the product bx to a. When used within an empirical context, or in a substantive theory, the linear function can be considered an elementary mathematical model of prediction, for it formally defines the relationship between two sets of elements (numerical values of x and y) in the functional form of an equation. It thus enables us to predict the expected numerical values of something unknown (v) from something that is known (or at least specified), the numerical values of x. We will explicate this further with some examples from research in nutritional anthropology.
Example 1
Our first illustration concerns the construction of a linear break-even model of caloric costs and gains, using data on sisal workers in Brazil provided by Gross and Underwood (1971). From their account, it is poignantly clear that many jobs in the field of sisal-fibre processing require very heavy labour at very low pay. Earning enough money to buy enough food to adequately maintain oneself and one's family is a difficult chore, at which not all are successful.
A "defibrer," as Gross and Underwood report, expends about 8.5 cal per minute, or on the average about 510 cal per hour. One person, from whom most of their data are derived, worked 28.2 hours per week or 4.028 per day. For his labour he received $3.65 per week or $0.52 per day. The food he and his wife consumed cost about $0.36 per day and contained about 7,145 calories. The amount allocated to food left only a narrow margin to cover other expenses in their lives.
The questions we will construct our model to answer are: How many hours must this person work to produce calories from food purchases equal to those lost by him and his wife in the course of their daily activities, including sisal work? How many hours of work would be required if the number of dependents (say children) increased?
In order to answer these questions, we need to complete the energy-expenditure picture. The worker sleeps eight hours daily at 68.4 cal per hour, which totals 547 cal per day. Another 1,800 calories are used in 12 hours of light activity, at least 150 cal per hour. In sum, his total fixed daily expenditure, excluding sisal work, is 2,347 calories. To this we must add the daily expenditure of his wife who uses 2,300 cal per day. Thus the total fixed daily expenditure requirement, e = 4,647 calories. To define the total caloric cost, C, we must also include caloric expenditure per hours of work, x. In sum, the total caloric cost is a function of both fixed daily expenditure, e, and the number of hours worked, x.
Thus C = f(e,x), or,
(2) C=e+cx
Referring to linear relation equation (1), we interpret e in equation (2) as the intercept, or daily fixed household energy expenditure without work, at x = 0; c is a slope co-efficient representing caloric cost of work per hour, x. To define the function empirically we insert the above values into (2), which gives:
(3) C = 4,647 + 510x
Using the rule of function (3), if the worker works 4.028 hours per day or x = 4.028, then 4,647 + 510(4.028) = 6,701.28, the total caloric cost.
Another function can be defined for caloric revenue, R. Since $0.52 is earned per 4.028 hours/day at work ($0.129/hour) and $0.36 buys 7,145 calories of food, each hour of work (x) gains 2,562.17 calories. Thus,
(4) R = 2,562.2x
To "break even," revenue, R. must equal total cost, C. Therefore, to answer the question concerning how many hours the worker must work to produce calories from food purchases equal to those lost by him and his wife in the course of all their daily activities, we set R = C and solve for x, or,
(5) 2,562.17x = 4,647 + 510x
x = 2.264
In other words, for caloric gains to equal caloric expenditures the worker must work 2.264 hours per day. This leaves about 1.75 hours of working earnings per day ($0.23) for non-food use.
To see just how narrow this margin is, let us take advantage of the model's utility for extrapolation, and imagine what would happen if, all other things being equal. this couple had children. Two children, each consuming about 1,700 cal per day, would add 3,400 cal to the fixed expenditure, e. This gives
(6) 2,562.2x = 8,047 + 510x
x = 3.921
This means that in order to break even, 3.921 hours of work or more than 97 per cent of this worker's wages would be needed for food. Three children would require 4.75 hours per day of work and would go beyond the limit of 4.028. We can also use the model to determine how much the worker's wages would have to be raised to support himself, his wife, and three children at a break-even level if no more than 28.2 hours of work per week were possible (a reasonable assumption considering the arduous nature of the work) and food prices remain stable (a more dubious assumption). The total cost function, C, would then be specified as
(7) C = 9,747 + 4.028x
C= 11,801.28
or 11,801.28 calories per day. Now if $0.52 can purchase 10,320.556 calories, then
(8) 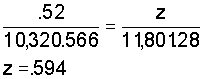
where z = $0.594 is the required daily wage. This amounts to a 14 per cent wage hike. And remember this is only to break even!
While this particular break-even model is an over-simplification of the real-life situation in Brazil, it does use the facts at hand to show how a model involving functional relationships can be formulated and how it can be manipulated to extrapolate the expected consequences of unknown, but specifiable, conditions.
In this example we were able to construct a model in which the parameters a and b were easily specified. We are usually not so fortunate. In most cases they must be determined or estimated with samples. The next example illustrates this more complex situation.
Example 2
The data presented in table 1, as well as other data, were used to design a method for measuring wealth in semi-cash economies (Ugalde, 1970). The data in the table were collected for a sample of 17 households in a Zapotec village in Oaxaca, Mexico, and comprise: (1) the weekly per capita food expenditures (in pesos); (2) the amount of cultivated land (in almudes half-acre); and (3) other general expenditures per capita per year, such as those for medicine and clothes.
We will use Ugalde's data to build a simple linear model for the relationship between food expenditures and land cultivated (an indicator of wealth). Our assumption is that the amount of food expenditures (y) can be approximated as a linear function of the amount of land cultivated (x1) or
(9) y=f(x1)=a + bx1
For the purpose of illustrating how the function works, we need only two representative data points to determine the two constants, a and b. We will explain later how to assure that the model reflects reality as accurately as possible.
Table 1. Food expenditures and wealth in a Zapotec village (in 1965 pesos)
| Household number | Food expenditures y | Land cultivated (almudes) x1 | General expenditures x2 |
| 1 | 6.00 | 4.00 | 89.00 |
| 2 | 6.00 | 2.75 | 71.00 |
| 3 | 8.00 | 11.00 | 230.00 |
| 4 | 5.00 | 5.75 | 45.00 |
| 5 | 3.00 | 3.50 | 45.00 |
| 6 | 15.00 | 11.00 | 135.00 |
| 7 | 11.00 | 6.00 | 160.00 |
| 8 | 5.00 | 2.50 | 169.00 |
| 9 | 12.00 | 10.00 | 174.00 |
| 10 | 3.00 | 8.75 | 117.00 |
| 11 | 9.00 | 1.25 | 318.00 |
| 12 | 15.00 | 17.00 | 591.00 |
| 13 | 12.00 | 19.00 | 747.00 |
| 14 | 15.00 | 14.00 | 643.00 |
| 15 | 8.00 | 0.00 | 80.00 |
| 16 | 8.00 | 6.75 | 97.00 |
| 17 | 12.00 | 8.50 | 68.00 |
Source: Ugalde, 1970, p. 516.
Let us select households 2 and 9 to provide data for the constants a and b. Substituting the observed x1 and y values into (9) produces a system of two linear equations:
(10) 6 = a + b (2.75)
12 = a + b ( 10)
which when solved simultaneously yield: a = 3.724 and b = .827. The linear function can, therefore, be defined as
(11) ![]() = 3.724 + .872x1
= 3.724 + .872x1
where ![]() = the predicted value of y, the amount of per capita
food expenditure; 3.724 = the peso amount spent on food when x1
= 0 (no land cultivated); and .827 = the peso amount of food
expenditure that increases for each unit increase in land
cultivated (almudes). For example, if x1 = 6 almudes,
then 3.724+ .827 (6) =
= the predicted value of y, the amount of per capita
food expenditure; 3.724 = the peso amount spent on food when x1
= 0 (no land cultivated); and .827 = the peso amount of food
expenditure that increases for each unit increase in land
cultivated (almudes). For example, if x1 = 6 almudes,
then 3.724+ .827 (6) = ![]() = 8.686 pesos of per capita food expenditure.
= 8.686 pesos of per capita food expenditure.
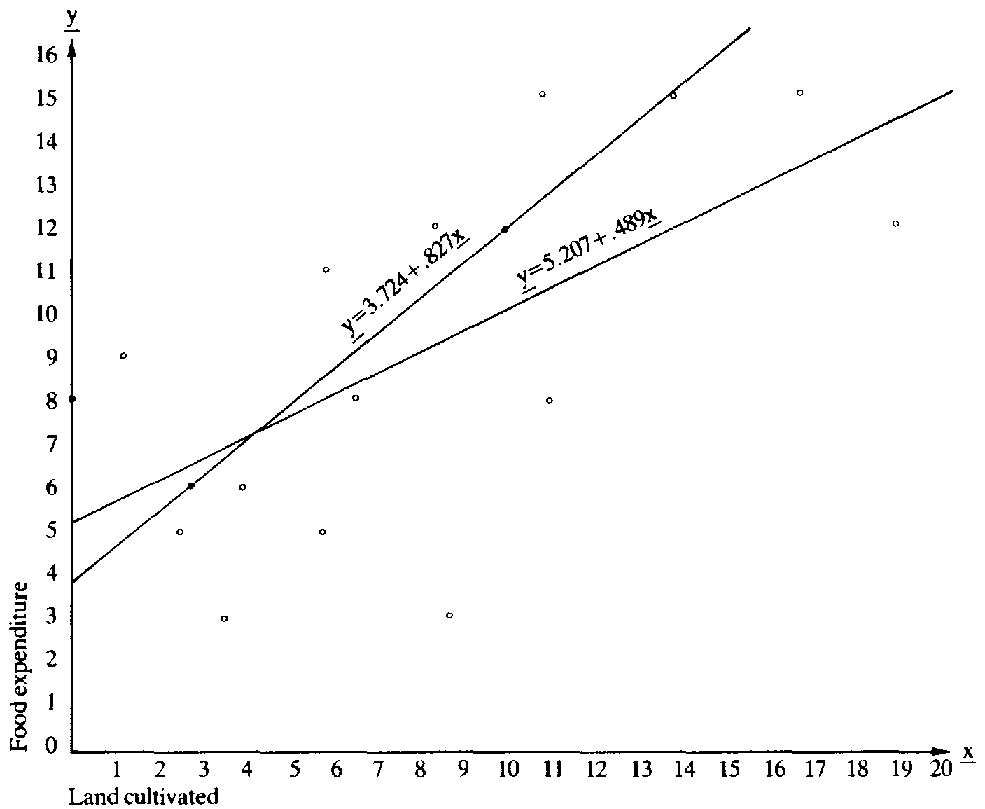
This model could be used to predict an infinite number of values over the range of y from a knowledge of all the values over the domain of x1 (i.e. 2.75 < x1 < 10). As figure 1 illustrates, the relationship shown in equation (11) describes a straight line.
A function of one variable can be graphed in two-dimensional space by positioning the independent variable x on a horizontal number line (abscissa) and the dependent variable y on a vertical number line (ordinate). The two lines are perpendicular and intersect at their origins (0). Any f(x) can be plotted as a point in this space by defining the values of x and y as an ordered pair (x, y). These serve as rectangular co-ordinates in the x, y plane. Thus, x = 6 and y = f or (6, 5) is a point 6 positive units along the abscissa and 5 positive units up the ordinate.
Using (II) to generate several points, and connecting them, produces a straight line. This line is consistent with the fact that .827, the slope, is constant over the domain of x'. Notice also that the line intercepts the y ordinate at 3.724, which is the value of y when x1 = 0.
Let us now plot the 17 observed points. Inspecting the vertical distances of these points from the line gives an indication of the accuracy or "goodness of fit" of the model to reality. Two things should be apparent. First, the fit is not perfect: not all observed values are on the line. Second, the actual plotted values of y are not collinear. The selection of any two data points to use in (10) to establish (11) was quite arbitrary. As the reader can discover for him/herself, selecting another two points, which are not collinear with the first two, produces a different set of constants (a and b). These in turn generate a different set of predicted yi's.
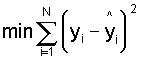
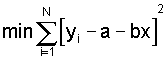
The question, then, is how do we select data points that can be used to establish the best set of predictions? The most common answer is to use the "least-squares" criterion and establish a function that minimizes the sum of the squared distances from all the points. That is,
(12) 
Since
(13) ![]() =a+bx
=a+bx
we can substitute (13) into (12) so that
(14) 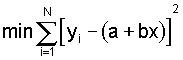
or
(15) 
Expanding (15), we get
(16) ![]()
Using elementary calculus, we differentiate with respect to a and b and set the partial derivatives equal to zero. That is,
(17) 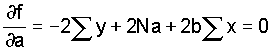
(18) 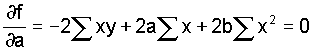
This gives
(19) 
and
(20) 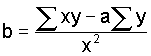
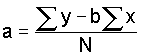
Rearranging and rewriting in terms of observed values produces two normal equations:
(21) 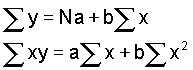
Solving these simultaneously yields the values of the constants a and b, which establish a function that minimizes the sum of the squared distances from all observed values. With Ugalde's data, these equations can be written
(22) 153 = 17a + 131.75b
1,417.75 = 1 31.75a + 1,495.06b
Solving (22) simultaneously yields, a = 5.207 and b = .489. The least-squares function can now be established as
(23) ![]() = 5.207 + .489x
= 5.207 + .489x
which is quite different from (11). Equation (23) is also graphed in figure 1.
A common way to measure the accuracy of the model is to calculate the "standard error of the estimate," Sy x, again with the criterion of "least-squares," where
(24) 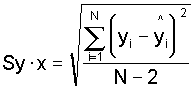
This method measures the square root of the average deviation of the sum of the squared distances of the predicted values of 9 from the actual values. Two degrees of freedom are lost in the denominator because we are estimating the parameters, a and b, from a sample. In this example,
(25) 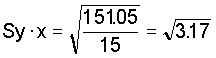
This equation indicates that, on average, the
expected error of a predicted value of ![]() , with the model (23), is 3.17 pesos.
Without a knowledge of x1 (land cultivated) our best
"least-squares" guess of yi (food expenditure) would be
the mean of y (y = 9), the expected error of which is given by
the standard deviation of y (Sy = 4.06). So using x1
in (23) we have reduced our estimation error .89 pesos on
average.
, with the model (23), is 3.17 pesos.
Without a knowledge of x1 (land cultivated) our best
"least-squares" guess of yi (food expenditure) would be
the mean of y (y = 9), the expected error of which is given by
the standard deviation of y (Sy = 4.06). So using x1
in (23) we have reduced our estimation error .89 pesos on
average.
Since sy · x is expressed in units of the dependent variable y, it cannot be used to compare the accuracy of linear functions using different variables. Therefore, it is customary to compute the co-efficient of determination, r² (rho²), where
(26) 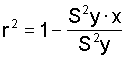
Rho² is a ratio of the proportional reduction in error in estimating y using x over the error in using y as given by Sy. The square root of r² is the common correlation coefficient, (rho). In this example,
(27) r² = 1 - 10.07/16.48 = .39
If all the variation in y were predictable from x, r² would be equal to 1.00. If no improvement is made, r² = 0 The correlation co-efficient, r = (.39)1/2 = .62.
Multiple Linear Regression
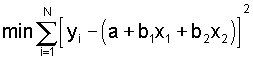
Multiple linear regression, in essence, is a straightforward extension of a simple linear function. (Multiple non-linear regression is also possible.) Multiple regression produces a multivariate function that allows us to predict the values of a dependent variable y from a number of independent variables or
(28) y + = f(xi) = a + b1x1, b2x2, . . ., bnxn
The least-squares criterion, 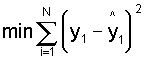 , can also be used to
estimate the parameters. For example, with two independent
variables, x1 and x2,
, can also be used to
estimate the parameters. For example, with two independent
variables, x1 and x2,
(29) 
Using the same methods of differentiation as before, we derive these normal equations
(30) 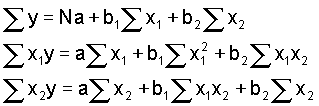
When solved simultaneously, these equations (30) yield the values of a, b1, and b2. We can also use the standard error of the estimate as before to measure the accuracy of the prediction.
(31) 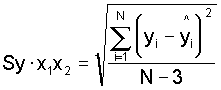
Notice that we lose an extra degree of freedom
because we are also estimating b2. Carrying on with
the example, let us add "general expenditures" to our
model to see if, with this addition, we can improve the accuracy
of our prediction of food expenditure ![]() :
:
(32) ![]() =f(x1,x2)=a + bx1 +
bx2
=f(x1,x2)=a + bx1 +
bx2
where y is as before, x1 = land cultivated, and x2 = general expenditures. Substituting observed values into (32) to estimate a, b1, and b2 gives:
(33) 153 = 17a + 131.75b1 + 3779b2
1417.75 = 131.75a + 1495.06b1 + 42768.25b2
42797 = 3779a + 42768.25b1 + 1628559b2
Solving these equations simultaneously yields:
a = 5.199; b1 = .335; and b2 = .005
The multiple regression equation is now established as
(34) ![]() = f(x1, x2) = 5.2 + .335x1
+ .005x2
= f(x1, x2) = 5.2 + .335x1
+ .005x2
When values of x1 and x2 are substituted into (34), a combined prediction of y is given. We can summarize (34) by saying that, in order to predict a household's per capita food expenditure, we start with 5.2 pesos and add .355 pesos for each almude of land cultivated and .005 pesos for each peso of general per capita yearly expenditure. The standard error of this estimate is Sy · x1x2 = 3.35 pesos, indicating that this method gives a poorer prediction than the simple linear prediction using cultivated land alone as an indicator of wealth (23), which we recall had a standard error of only 3.17 pesos. The reader can find that the simple linear function of general expenditures alone is
(35) ![]() = f(x2) = 6.523 + .011x2
= f(x2) = 6.523 + .011x2
where ![]() is as before and x2 = general
expenditures, and Sy · x2 = 3.39 pesos. This result
indicates that the amount of general household expenditures is
not as accurate a predictor of per capita food expenditure as
land cultivated (x1) and, when combined with the
latter, lowers the accuracy of the prediction.
is as before and x2 = general
expenditures, and Sy · x2 = 3.39 pesos. This result
indicates that the amount of general household expenditures is
not as accurate a predictor of per capita food expenditure as
land cultivated (x1) and, when combined with the
latter, lowers the accuracy of the prediction.
Space prohibits a further discussion of several issues: multiple and partial coefficients of determination and correlation (in the example above r²=.32 and r = .567); adjustments made due to sampling variation (cf. Cohen and Cohen, 1975); and the extensions of multiple regression analysis to factor analysis (Rummel, 1970) and casual inference analysis.
Up to this point we have assumed, for the sake of simplicity, that real-life situations can be approximated by linear functions. In many cases this is true. In other cases, linear assumptions can be quite unrealistic and, occasionally, downright absurd. Therefore, it is always advisable to consider the nature of expected relationships among variables before proceeding too far.
In nutritional anthropology it is easy to think of many relationships that might be nonlinear. For example, caloric and/or protein requirements are usually not linearly dependent on age. They may increase from childhood to adulthood, but, at a certain age, activity, among other things, diminishes and so will certain food requirements. The nutritive value of vitamin D is certainly not a linear function of intake quantities, for, although a certain amount is desirable, too much is toxic. Even satisfaction with a highly desirable food may decline with frequency of servings because of montony ("I love steak but would hate to have it every day"). Let us consider this further and see how a non-linear functional relationship can be derived. Assume that food satisfaction, S. is a function of both hedonic value (desirability), v, and the frequency served. q. That is
S=f(v · q)
or
S=v · q
But if
v= f(q).
that is, hedonic value is itself a function of frequency, q (say desirability declines with frequency of servings), then
v = a - q
where a = the intercept. Thus.
S=f(q) · (q) can be written
S = (a - q) · (q) which gives
S = aq - q²
which is a non-linear, quadratic (second-degree) function. This model suggests that food satisfaction increases with the frequency of servings of a desirable food up to a certain point, but beyond that satisfaction declines.
The linear function y = f(x) = a + bx, which we have already examined, is but one member of a family of polynomial functions, the general form of which is
(36) y=a0+b1x+c2x2+. . .+znxn
The methods already discussed for establishing a linear function can, by extension. be easily applied to a polynomial function of degree n. All that is needed is to substitute n + 1 data points into the general form of the equation and solve the resulting n + 1 equations simultaneously for the parameters a, b, c, . . ., z. With more than n + 1 data points, the method of least-squares can be used and the standard error of the estimate again employed to measure the goodness of fit.
We consider the quadratic, a common explicit non-linear function of degree 2 (the largest exponent), the general form of which is
(37) y=f(x)=a+bx+cx2
This function can be used to build models where the values of y, the dependent variable, are assumed to increase (decrease) with unit changes in x, the independent variable, to a critical point beyond which they decrease (increase). When graphed, the quadratic function can be described as a curve with one bend in it; the particular shape depends on the signs and magnitudes of the parameters. We use a quadratic function in the following example.
Example 3
Most scholars tend to agree that the observed variation and flux in the local group size of human foraging populations represent, inter alia, adaptive responses to the temporal and spatial availability of food resources. In this context, it has been suggested that there are both upper and lower limits to optimum group size.
Lee (1972), for one, suggests that "work effort" is the key intervening variable that modulates the relationship between local group size and food resources. As group size increases, work effort must also increase to supply food, and with more procurement pressure an area becomes depleted of floral and faunal foods. Together, these factors result in either greater per capita work effort or a substandard diet. Thus too large a group is a disadvantage, and upper limits are maintained by the principle of least effort. Less obvious, but equally real, are lower limits. Co-operation in activities related to hunting (detection, tracking, capturing, processing, and transporting) and in those related to gathering (infant care, transport, and detection) conducted in multi-person groups tends to produce a more abundant and secure food supply than individual efforts. Therefore, too small a group may also be a disadvantage.
What seems to describe the relationship among the factors of group size, work effort, and productivity is the law of diminishing marginal returns, whereby procurement efficiency (production per unit of labour) increases up to a critical point beyond which it declines. This pattern suggests the proposition that the per capita food productivity of foraging groups is an increasing-decreasing (simbol) quadratic function of local group size.
We will explore the utility of this proposition using data provided by Lee (1969) on camp size and meat procurement among !Kung foragers in the Kalahari Desert in Botswana. Over a 28day period, he recorded meat output and the number of persons at the Dobe camp. During week 2 Lee himself provided meat. Therefore, like him, we shall exclude it from consideration as unrepresentative. Table 2 contains the mean group sizes and total number of pounds of meat procured each week. We will now construct a non-linear model of the relationship between meat procurement, y, and weekly mean group size, x.
(38) ![]() = f(x) = a + bx + cx²
= f(x) = a + bx + cx²
Inserting actual values into this equation gives the following system of three equations.
(39) 104 = a + b(25.57) + c(25.57)²
177 = a + b(34.29) + c(34.29)²
129 = a + b(35.57) + c(35.57)²
The simultaneous solution set is: a = -4131.9; b = 282.95; and c = -4.587. The quadratic function is
(40) ![]() = f(x) = -4131.9 + 282.95x - 4.587x2
= f(x) = -4131.9 + 282.95x - 4.587x2
This equation describes an increasing-decreasing relationship between meat production and mean weekly group size. Were there more data points (weeks), we could have used the leastsquares criterion and constructed normal equations to derive the best fitting line, and the standard error of the estimate could also have been employed to measure the error.
Table 2. !Kung Dobe camp size and meat output
| Week | Date |
Average camp size |
Meat output (Ibs) |
| 1 | 6-12 July |
25.57 |
104 |
| 2a | 13 - 19 July |
28.29 |
80 |
| 3 | 20-26 July |
34.29 |
177 |
| 4 | 27 July - 2 Aug. |
35.57 |
129 |
a. Excluded from consideration.
Source: Lee, 1969, p. 66.
Let us make one last important observation. The critical point of a function is an extreme in the form of a maximum or minimum. Critical points specify values of the independent variable when the slope of the function (rate of change) is zero. Determining these values can often provide useful information. In the !Kung example, the critical point can provide an estimate of the optimum group size for meat production. That is, it can specify the value of x that, according to the rule of the function, will result in the largest value of y (meat produced) when it is inserted into (40). To find the critical point we evaluate the first derivative, f'(x), of function (4()) and equate it to zero.
(41) f'(x) = 289.95 - 9.174x = 0
289.95 = 9.174x
*x = 30.84
Thus *x = 30.84 is the mean group size at the maximum critical point of function (40), and the value of y associated with *x, by the rule of the function, will be the largest amount of meat produced or
(42) y = f'(*x) = -4131.9 + 282.95(30.84) - 4.587 (30.84)²
y = 231.556
Thus, the optimum camp size is 30.84 persons, and at this size the expected production of meat is 231.56 pounds per week. The reader can check this maximum by substituting slightly lower and higher values of x into (42) and determining if a y > 231.56 lbs. of meat exists. It is of some interest to note that the mean group size, x, over the 21 days of weeks 1, 2, and 4 = 30.095; and over the 28 days of all four weeks, x = 30.929. These values are very close to *x = 30.84 deduced from the model, and suggest that over the long run !Kung group size is probably near optimum for meat production.