This is the old United Nations University website. Visit the new site at http://unu.edu
5. Efficiency of the procurement sub-system
The performance of the fry and fingerling procurement
subsystem can be evaluated according to several technical and
economic criteria:
- Adequacy and responsiveness of annual fry catch to meet annual
stocking requirements.
- Mortality rates in gathering, storage, and distribution.
- Allocative efficiency of prices in fry distribution and
fingerling rearing.
An earlier study, which applied these three criteria, concluded that there was no shortage of fry in the economic sense in the Philippines in 1974, 1976, or 1977. The fry procurement sub-system was judged to be technically efficient, but it was found that high mortalities occur once fry are deposited in fishponds. The fry distribution network was found to be highly price efficient, but the fingerling rearing business was found to be much less price efficient, with high profit rates accruing to nursery-pond operators. The major findings of this earlier study are summarized here, updated with more recent fry and fingerling price data and with the findings of other recently concluded studies. No data are available for the other years since 1974.
Adequacy of Fry Supply
It is commonly alleged that there is a shortage of fry in the Philippines, and that production of market-size milkfish is consequently constrained.25 The term "shortage" can lead to confusion unless it is clearly defined. In the usual economic sense, a shortage can only arise if some external factor, such as government price control produces market distortions, and makes it impossible for demand and supply to achieve market equilibrium. Shortage develops when consumers demand larger quantities of the commodity, at the price set by the government, than producers would be willing to supply. With the release of price from control, equilibrium price would again be restored where quantity demanded would equal quantity supplied, and the shortage would be removed.
In the Philippines allegations of fry shortage do not conform to the above concept of shortage. Fry price is not effectively controlled despite Presidential Decree 704 which sets a maximum price of P80 per thousand fry. Price freely moves to market equilibrium, eliminating shortage in the economic sense. Prices range from P50 or less during the peak season to over P100 during lean months. The reported fry shortage refers simply to the allegation that the annual catch of fry is less than the quantity recommended by biologists to maximize production from existing pond sites. Shortage in this sense, therefore, is not due to market distortions.
The recommended annual stocking rate commonly used to project fry requirements is 10,000 fry per hectare.26 Based on 176,000 ha of fishponds in the country, extrapolated annual fishpond fry requirements would be 1.76 billion fry. When the fry required by nursery-pond operators to supply fingerlings to fishpens are added to this figure, annual fry requirements would reach approximately 2 billion. Until the late 1970s the most widely accepted estimates of Philippine fry catch ranged from 300 - 900 million.14 From these estimates, catch appears to fall far short of requirements as recommended by biologists.
However, it appears that this shortage has been highly exaggerated. To begin with, the recommended 10,000 fry per hectare assumes that optimum pond designs and conditions exist throughout the country, and this is clearly not the case. Additionally, fry catch in 1974 and 1976 was considerably higher than earlier estimates. Dealing first with the catch estimates, it is possible to estimate catch by extrapolation from observed stocking rates in fishponds and fishpens.
Based upon stocking rates per hectare of rearing area as reported by Librero et al.,27 it can be estimated that in 1974 approximately 640 million fry were stocked in rearing ponds, representing an average annual stocking rate of 3,640 fry per hectare of total fishpond area (176,000 ha includes undeveloped areas) or a rate of 4,500 fry per hectare of actual operational area. Both of these figures are considerably lower than the 10,000 fry per hectare commonly used to project annual fry requirements. An additional 510 million fry were stocked in nursery ponds to supply 125 million and 208 million fingerlings to rearing ponds and 7,000 ha of fishpens respectively. The total quantity of fry stocked in rearing and nursery ponds in 1974 was thus 1.15 billion. To estimate 1974 fry catch from this stocking figure, one must adjust for mortality in gathering and storage prior to transport (5.6 per cent) and during transport (11 per cent) as observed by Librero et al.,16 to reach an estimated 1974 catch of 1.35 billion fry.
If one assumes approximately the same stocking rates in 1976 as in 1974, and adjusts for the reduction in Laguna de Bay fishpen area due to typhoons from 7,000 to 4,000 ha, total fry stocked would have been lower by 160 million, or equal to a catch of 1.16 billion fry.
Stating that actual stocking rates are less than recommended rates still begs the question of whether actual rates are in fact optimal in terms of maximizing profits (not maximizing yield) of producers. Economic not biological criteria must be applied to determine the optimum stocking rate. Given 1978 prices of inputs and output, the optimum annual stocking rate was estimated to be approximately 6,700 per hectare of actual operational area (see chapter l l l). Observed stocking rates in 1978 were almost 6,000 fry per hectare for those farms using inputs; a rate lower than the optimum rate. However, given present pond design and total area, biological limitations to natural food production in ponds, and the current production techniques, it will be several Years or more before the majority of fishponds can apply this optimum rate. In the meantime, a fry shortage does not appear to exist.
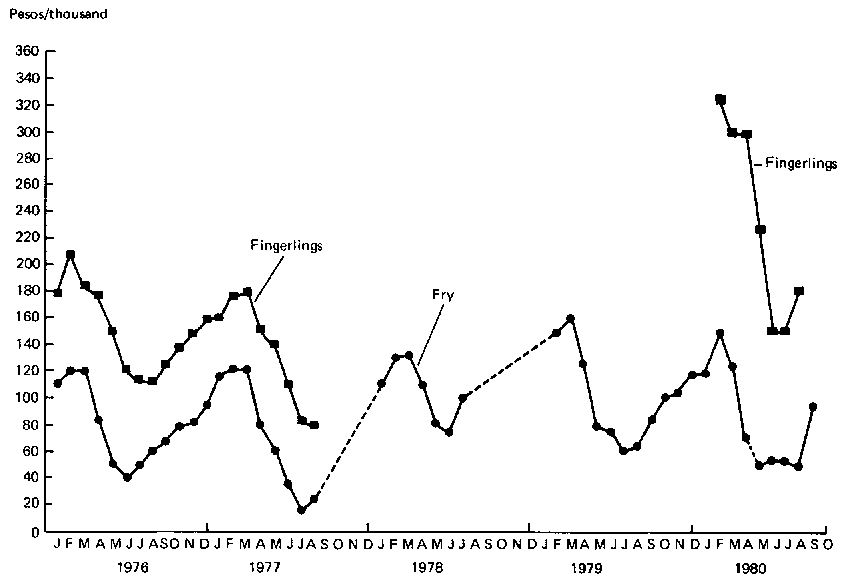
Indirect evidence also provides support to the argument that the Philippines has not Yet reached the maximum sustainable yield of its fry resource and that the industry adequately transmits demand and price shifts back to gatherers and concessionaires. The rapid decline in fry prices in 1977 (fig. 30) with lows not experienced since 1971, can be traced to the reduced fingerling demand from Laguna de Bay fishpens. With reduced fingerling demand because of widespread destruction of fishpens by typhoons in late 1976, these low prices indicate an adequate supply for 1977.
This conclusion was confirmed by information obtained from gatherers and pond operators.12b First, fry gatherers in llocos and Mindanao stopped gathering in July 1977, claiming that prices had fallen to a level insufficient to reward their efforts. Second, nursery-pond operators were forced temporarily to stop purchasing fry in the same month because their nursery ponds were fully stocked. Third, only a minority (20 per cent) of rearing-pond operators claimed to have been unable to stock the quantity of fry they desired in 1976. Close examination of the reasons for these difficulties showed that 11 per cent had difficulty restocking ponds that had been flooded by the same typhoon that prematurely halted the llocos fry-gathering season in late May 1976. Six percent had insufficient capital to make the desired purchase, the remaining 3 per cent believed that the development of lab-late (microbenthic algae) was insufficient to support their normal stocking rates. None said fry were simply not available at any time of the year.
Similarly, Chong and Lizarondo 28 report that only 13 per cent (n=324) of the milkfish producers interviewed in 1979 complained of a fry shortage. In many cases, these complaints appear to be complaints of high fry prices rather than claims of non-availability. Finally, it should be pointed out that the 1970s saw an almost 50 per cent increase in output of milkfish due to the added output from fishpens (table 1), and continued growth in output from fishponds.
Therefore, both direct and indirect evidence lead to the conclusion that the fry industry was able to supply sufficient fry to meet the stocking requirements of rearing- and nursery pond operators during the late 1970s. Severe weather problems such as early typhoons that curtail the fry season in llocos and cause floods in Luzon, can cause temporary shortages, however. Substantial growth in fishpen area might also jeopardize the procurement sub-system's performance, but at present, catch from the natural fishery appears adequate.
Stating that fry catch is at present adequate, does not imply of course that it will be adequate in the future. Unfortunately, it is not now possible to determine how close present fry catch is to its maximum potential. As discussed earlier, fry gathering costs and the shape of the sustainable yield curve may cause open-access equilibrium to be reached before biological overexploitation occurs. Comparisons made between Taiwan and Philippine milkfish-pond productivity per unit of fry input often tacitly assume that fry catch can be greatly expanded. For example, it has been reported that Taiwanese fishpond operators, farming approximately 15,000 ha, have been able to achieve relatively stable Yields despite wide fluctuations in annual fry catch.29 For every 1 million fry stocked, Taiwan was able to produce an average of 140 tonnes of marketable milkfish during the 1963-1974 period. In contrast, in the Philippines, 80 tonnes were produced for each 1 million fry stocked in 1974. From this information it is tempting to conclude that Philippine production can be increased significantly with no further increase in fry catch.
Unfortunately, it is not quite that simple. To begin with, milkfish in Taiwan are generally marketed at larger sizes than are Philippine milkfish. In fact, the higher average weight per fish in Taiwan (350 - 450 grams compared with 200- 250 grams in the Philippines) explains most, if not all, of the 60tonne difference per 1 million fry stocked. Therefore, one might conclude that the Philippine milkfish system could be similarly productive, if only larger fish were grown. However, Philippine consumers generally prefer smaller not larger fish. This preference is indicated by the fact that market price per kilogram generally declines with size (see chapter V). Consequently, it may be less profitable for producers to grow larger fish. Although no thorough economic analysis of the costs and benefits of growing larger fish has been performed it is worth hypothesizing that increased productivity from Philippine fishponds, given current consumer preferences, can only be obtained through intensification of production techniques. This intensification would necessitate added input use, including increased stocking rates. For this expansion in productivity, fry catch from the natural fishery may not be adequate.
Mortality Rates
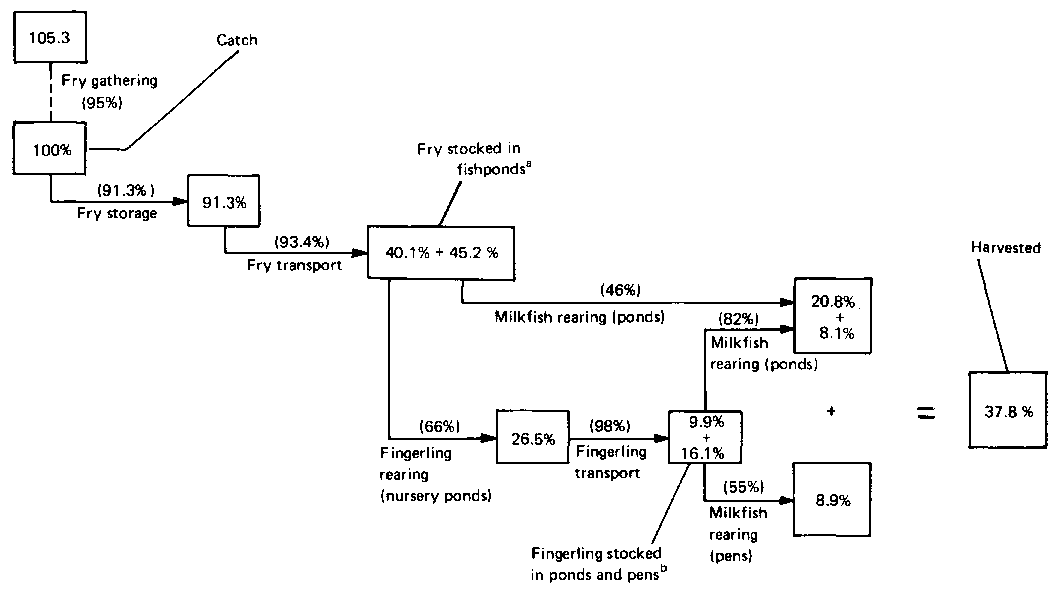
Estimates of mortality rates in the milkfish resource system, including the fry and fingerling procurement sub-system, have been made by various researchers. 12b,15,30 Smith estimated that of every 1,000 fry caught alive only 378 are eventually harvested at marketable size (fig. 31).
Milkfish Survival: Fry Gathering to Harvest, 1976. Percentages in parentheses are survival rates during the particular activity. Percentages in boxes are percentages of original catch surviving at that stage. (Notes: a. 47 per cent of fry are stocked in nursery ponds and 53 per cent are stocked in rearing ponds. b. 62 per cent of fingerlings are stocked in fishpens and 38 per cent are stocked in rearing ponds. Overall survival, catch to harvest: 37.8 per cent. Overall mortality, catch to harvest: 62.2 per cent. Source: See note 12(b).
Mortalities in storage and transport were estimated at 8.7 per cent and 6.6 per cent respectively. Further, transport mortality was shown to be significantly correlated with time in transport and the use or non-use of oxygenated water.31 It was also found that a six-hour trip by air was likely to produce no higher mortality than a six-hour journey by road, though covering a much longer distance. Kumagai et al.15 have observed higher mortalities (14.3 per cent) during catch than the 5 per cent estimate reported by Smith.12 b However, a rigorous examination of the relationship between stress caused by transport and mortality after stocking has not been made. Nor has an adequate assessment been conducted of the added costs that would be incurred to bring about reductions in mortality during gathering, storage, and transport. It is possible that the added costs may outweigh the benefits.
While small increases in survival rates may be possible in the procurement subsystem, there appears to be more room for improvement in the transformation sub-system. In fishponds, for example, survival during rearing from fry to market size is less than 50 per cent. In fishpens, survival during rearing from fingerling to market size is less than 45 per cent. While these survival rates in absolute terms may appear reasonable, the range in survival rates from one fishpond to another is sufficiently great (30 - 85 per cent) to indicate that the rates could be increased for most fishfarms. The general lack of acclimatization of fry and fingerlings by fishpond and fishpen operators after transport, but before stocking, has been widely observed. After purchase, many pond operators place their fry directly into their pond, disregarding salinity or temperature differences between transport containers and the pond. Improvements beyond the 80 tonnes of harvest per 1 million fry caught thus appear to be possible through improvements in care and handling of stocking materials by entrepreneurs in the transformation (rearing) sub-system. In contrast, the technical efficiency of the procurement sub-system in terms of reasonable survival rates in storage and transport appears high.
Allocative Efficiency of Prices
Another criteria by which the procurement sub-system has been evaluated is through measures of pricing efficiency. In other words, how well does price perform its allocative function in dimensions of space,time,and form? Because of the seasonal nature of fry supply, fry prices fluctuate widely each Year (fig. 30). The allocative tasks of the market price mechanism are thus not easy, especially during periods of rapidly falling prices early in each fry season.32 Implied is the need for rapidly available price information from various locations around the country. Such information would reflect the prevailing supply- and-demand conditions. If the ability of middlemen to act on these relative prices and to engage in arbitrage is high, spatial equilibrium among the various markets would result. Despite this difficult task, the spatial efficiency and degree of market integration of the fry procurement sub-system is high. Prices in 11 major fry markets from January 1976 to August 1977 (representing 17 routes} were found to be highly correlated, indicating adequate flow of information among the markets (table 6). For individual routes, however, there were occasional price differentials significantly in excess of the transfer costs between markets.33 The spatial pricing efficiency of the fry procurement subsystem was high during the peak fry season (MayDecember), but less so during the non-peak winter months (January - April).
In addition to high correlation on most trading routes, a constant mark up was observed on 14 out of the 17 routes, allowing the inference that monopsony behaviour of middlemen is not prevalent in the system. A constant absolute marketing margin between buyers and sellers in the various markets studied would not be consistent with middlemen's monopsony behaviour, but would instead be consistent with the competitive market model in which scale economies are limited and the marginal cost of providing the marketing services is horizontal over the relevant range.34 Fry procurement services are labourintensive, and no specialized storage or transport facilities are required; thus, the assumption of a highly elastic marketing services supply function is quite reasonable.
Temporal and form dimensions of price allocation are inherently interwoven because fry are generally not stored (by stunting) for future use. Unlike Taiwan, where overwintering of fry is practiced, in the Philippines holding of fry in ponds is most usually associated with their growth to fingerling size. Therefore the form and temporal efficiency aspects of the procurement sub-system can be treated as one, and related primarily to the nursery-pond operations in which fry are transformed to fingerlings. In contrast to the high spatial price efficiency, the sub-system's form price efficiency is much reduced. A high degree of correlation existed between fry and fingerling prices for the period January 1976 - July 1977 (table 7). The mark up in prices from fry to two-, three-, and four-inch fingerling was also found to be constant. Fingerlings are measured by finger-width. A two-inch fingerling, for example, is two finger-widths long, or approximately five centimetres. However, profit rates of nursery-pond operators, representing the excess by which the differential between fry and fingerling price exceeded the transformation (fry to fingerling rearing) costs involved, far exceed what one would predict as likely under conditions of perfect competition {table 8). Based on deducting fry to fingerling transformation costs from the appropriate lagged price differentials, net returns (the residual) to nursery-pond operators' capita!, own and family labour, and management were P13.9,P15.7 and P34.2 per thousand two-, three-, and four- inch fingerling respectively.
TABLE 6. Intermarket Price Relationships among Major Cities in the Philippines
| Route | Number of months | Pj = a + bPi + ei a | Rb | Mark-upc |
| General Santos-Davao | 19 | Pj =16.80+0.87Pi | 0.91 | constant |
| General Santos-Iloilo | 20 | Pj=4.74+1.39Pi | 0.93 | percentage |
| General Santos-Manila | 21 | Pj =13.48+1.22Pi | 0.88 | constant |
| Davao-Iloilo | 18 | Pj =- 5.54+1.31Pi | 0.86 | constant |
| Davao-Manila | 19 | Pj =2.75+1.20Pi | 0.83 | constant |
| Zamboanga-Iloilo | 12 | Pj =8.33+0.91 Pi | 0.83 | constant |
| Zamboanga-Manila | 13 | Pj -10.34+ 0.92Pi | 0.90 | constant |
| Cagayan de Oro-Manila | 6 | Pj = - 37.60+2.39Pi | 0.97 | percentage |
| Antique-lloilo | 15 | Pj =22.83+0.77Pi | 0.81 | constant |
| Antique-Roxas | 15 | Pj =6.91+0.98Pi | 0.90 | constant |
| Antique-Manila | 15 | Pj =15.14+1.01Pi | 0.91 | constant |
| Iloilo-Roxas | 15 | Pj =3.05+0.98Pi | 0.87 | constant |
| Iloilo-Manilad | 20 | Pj =15.33+0.80Pi | 0.90 | constant |
| Bicol-Manilad | 7 | Pj =17.12+0.76Pi | 0.88 | constant |
| Laoag-Dagupan | 10 | Pj =- 5.65+1.35Pi | 0.97 | percentage |
| Lacag-Manila | 12 | Pj =6.63+0.96Pi | 0.93 | constant |
| Dagupan-Manilad | 10 | Pj =6.28+1.13Pi | 0.97 | constant |
Source: See note 12(b).
a. Pi = price in exporting market.
Pj = price in importing market.
b. All correlation coefficients are significant at the 1-per cent
level.
c. Rejection of H0: b = 1 implies that the slope
(b) is
significantiv greater than 1 at the 5-per-cent level and that the
price mark-up between the two markets is not constant, but is a
percentage mark-up.
d. Trade between these markets is reversed at certain times of
the year.
TABLE 7. Fry and Fingerling Price Relationships
| Product forms | Pfing = a+ bPfry + ej | Ra | Mark-up |
| Fry-2" fingerling | P2 " =55.9 + 0.99Pfry (0.21) | 0.75 | constant |
| Fry-3" fingerling | P3" =88.5 + 0.89Pfry (0.12) | 0.86 | constant |
| Fry-4" fingerling | P4" = 110.9 + 1.32Pfry (0.23) | 0.81 | constant |
Source: See note 12(b).
a. All correlation coefficients are significant at the 1-per-cent
level.
Little evidence of collusive behaviour among Bulacan and Rizal nursery-pond operators that might explain these high net returns was found, however. Though primarily centred in and around the town of Malabon, Rizal, nursery-pond operators claim to have contact only when purchasing from each other to fill large orders or when renting each other's boats for fingerling transport. Those who sell their fry to nursery-pond operators claim, however, that experienced buyers can use the comparative-density counting technique to their advantage. They do so by selecting containers with less than the average number of fry as the basis for counting the number of fry in the whole shipment. These allegations are really no more than innuendos, but certainly disagreements between buyers and sellers over quantities of fry traded are frequent.
Nursery-pond operators appear to have benefited both from their control of the fry resource through the provision of credit to concessionaires and from their ability to capture high rates of return for their fingerling-rearing operations. These rates of return, however, do not appear to be the result of discriminatory barriers to entry, but rather due to factors within the fishpen business working in favour of established nurserypond operators. The unexpected increase in fingerling demand due to fishpen operations in the early 1970s provided the opportunity for the larger nursery-pond operators to consolidate their positions. Several years passed before new entrants to the fingerling business could become established, and then, fishpen area and fingerling demand began to decline for numerous reasons elaborated upon in chapter IV. Rapid shifts in fingerling demand during the 1970s thus made it difficult for price to perform efficiently its form allocation function.
6. Some implications of a milkfish hatchery
TABLE 8. Net Return (Loss) to Nursery-Pond Operators for Rearing Two-, Three-, and Fourd-Inch Fingerling, January 1976-July 1977 (Pesos per Thousand)
| Net returns (loss)a | |||
| For 2" fingerling | For 3" fingerling | For 4" fingerling | |
| 1976 | |||
| January | 76.0 | 15.5 | 11.5 |
| February | 42.3 | (8.9) | (13.2) |
| March | 28.6 | (18.6) | 179.9) |
| April | 28.6 | 0.5 | (18.2) |
| May | 13.1 | 25.5 | 34.4 |
| June | 14.8 | 39.9 | 71.8 |
| July | 0.8 | 42.5 | 71.4 |
| August | (8.3) | 45.8 | 97.7 |
| September | (5,9) | 59.1 | 77.6 |
| October | (4.3) | 54.2 | 90.3 |
| November | 1.9 | 57.5 | 88.2 |
| December | (8.2) | 49.1 | 108.4 |
| 1977 | |||
| January | 1.4 | 19.2 | n.a. |
| February | 21.7 | (16.9) | n.a. |
| March | 3.2 | (31.8) | n.a. |
| April | 17.8 | (1.5) | (5.1) |
| May | (0.4) | (18.7) | 23.9 |
| June | 12.2 | (6.4) | 47.8 |
| July | 27.9 | 6.3 | n.a. |
| Weighted average for whole period | 13.9 | 15.7 | 34.2 |
Source: See note 12(b).
a. Net return (loss to nurserypond operator's capital, own and
family labour, and management).
n.a. = not available.
Laguna de Bay will continue to influence fry demand, a more dramatic impact on the existing fry-procurement sub-system in the future is likely to come from the supply side in the form of milkfish fry hatcheries. Some limited success has already been achieved in inducing pond-raised milkfish to spawn in captivity. Although commercial hatcheries are probably several years, if not more than a decade, in the future, it is useful to comment briefly here on possibilities for their development and management.
While it was earlier argued that fry catch is adequate to meet present stocking requirements, it was also pointed out that increased production from existing pond areas will require more intensive production techniques, including increases in stocking rates. Since it is not possible at present to determine the true extent of the fry resource, it is difficult to say whether or not milkfish hatcheries will be required. However, if they can produce lower-cost fry, they will be a boon to milkfish producers, and ultimately to consumers.
The long-term success of hatcheries depends upon whether they can supply fry in large quantities at a competitive price and of a quality equal to those available from the natural fishery. Because of the highly seasonal nature of fry supply from the natural fishery, and consequent price fluctuations, it is possible that hatcheries will only be able to compete during the off-peak fry season when prices exceed P90-100 per thousand. For purposes of rough comparison, hatcheryproduced fry of tilapia (Sarotherodon niloticus) are currently selling for P110-200 per thousand depending on size. If fry are available from hatcheries in this manner, hatcheries could have a stabilizing effect upon fry prices that would greatly benefit the milkfish industry and aid intensification programmes that require multiple stockings. In addition, they could provide fry even after typhoons, a form of insurance stock that would also greatly benefit the industry.
The extent to which hatcheries will displace those at present dependent upon the natural fishery depends on the location of hatcheries and the timing of their production. There is the opportunity, if hatcheries are government regulated, to phase their production so that the displacing effects are gradual, allowing for adjustment within the natural fishery. For example, hatcheries could be used primarily as a price stabilization and insurance scheme rather than one that would totally replace the natural fishery. If hatcheries are privately owned and are able to produce large quantities of competitively priced fry, one can expect the impact on gatherers, municipalities, and middlemen depending on the natural fishery to be more rapid and dramatic. Since the procurement sub-system at present supports approximately 175,000 persons, careful planning of hatchery development is of major importance and will require continued monitoring of progress towards artificial propagation of milkfish so that the impact on the natural fishery and the milkfish industry can be managed for maximum social benefit.