Introduction
Methods
Results
Discussion
References
Discussion
Correspondence to: Keyou Ge.
* This paper is also published currently in The Asia Pacific Journal of Clinical Nutrition, but is included here for the sake of convenience and completeness, with permission of the Editors-in-Chief of both journals.
K. Ge1, R. Weisell2, X. Guol, L. Cheng1, H. Ma1, F. Zhai1 and B. M. Popkin3
1Institute of
nutrition and Food Hygiene, Chinese Academy of Preventive Medicine, 29 Nan Wei Road,
100050 Beijing, People's Republic of China; 2Food
Policy and Nutrition Division, Food and Agriculture Organization of the United Nations,
Rome, Italy; and 3Nutrition Department, School of Public Health, University of
North Carolina at Chapel Hill, USA
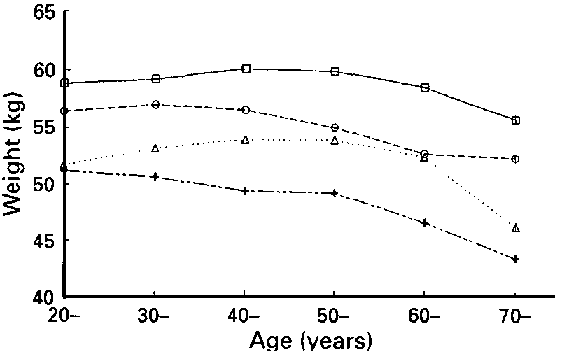
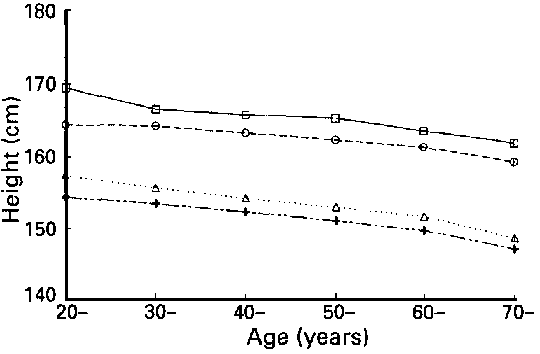
Patterns and trends in the body composition of Chinese adults are studied with data from the 1982 China Nationwide Nutrition Survey (CNS-82) and the 1989 China Health and Nutrition Survey (CHNS-89). The CNS-82 showed rural inhabitants were ~3 kg lighter than urban residents and ~2.2 cm shorter. Males were heavier (55.2 ± 7.4 vs 50.7 ± 8.0 kg) and taller (165.3 ± 7.3 and 153.5 ± 6.3 cm). Using a cut-off for underweight of a body mass index (BMI: kg/m2) <18.5 and for obesity of >25, 11.6% and 12.9% of the urban and rural sample were underweight and 9.8% and 6.9% respectively were overweight.
The CHNS-89 surveyed 5138 adults aged 20-45 in eight selected provinces. The proportion of underweight in both urban and rural samples declined slightly ± (1.3%) but the proportion of obesity increased considerably (4.8% for the urban sample and 2% for the rural one). Increased income was significantly associated with reduced low body mass index (BMI: kg/m2) in the urban sample while, for the rural and overall samples, the opposite was found for obesity. Provincial patterns in energy intake were not associated with the distribution of BMI while occupation was. In particular, government officials and housewives were much more likely to be obese as also were subpopulation groups consuming greater proportions of energy from animal sources.
Over 80% of the population fell in
the normal BMI range (18.5-25). This may relate to the relatively even distribution of
food in China during the past several decades.
China is a developing world with more than 1.1
billion people, accounting for about 22% of the world's total population, but occupying
only 7% of the world's arable land. The per capita food availability has fluctuated over
the past 40 years since 1949, when the People's Republic of China was founded (State
Statistic Yearbook, 1991). With the rapid development of the economy since 1978, there was
a marked improvement in the per capita income and food consumption of the people. Food
patterns have also changed in the 1980s (Ge, Chen & Shen, 1991; Popkin et al., 1993).
During this decade China conquered problems of food scarcity at the national level and has
undergone a remarkable dietary transition. In order to examine the changes in diet and
nutritional status, two large-scale surveys were conducted in the 1980s. One was the
nationwide nutrition survey in 1982 (CNS-82), which consisted of a dietary survey,
anthropometric measurements, clinical examinations and biochemical assays; the other was
the 1989 China Health and Nutrition Survey (CHNS-89), which collected detailed social,
economic and ecological information in addition to biological data.
The International Dietary Energy
Consultancy Group proposed the use of body mass index (BMI: kg/m2) for
specifying chronic energy deficiency (CED) in adults, and cut-off points were identified
for its classification (James, Ferro-Luzzi & Waterlow, 1988). For assessing
nutritional status, the BMI of Chinese adults was examined based on the CNS-82 and CHNS-89
data and the distribution of BMI was linked with some dietary and social economic factors.
The main results and the* possible significance are discussed in this paper.
CNS-82
The 1982 China Nationwide Nutrition Survey covered 25 provinces and three municipalities, all administrative units directly under the control of central government with the exception of Tibet. A two-stage random sampling method was used to select the survey households. Four to 20 survey sites were chosen in each province/municipality by reference to its population size, and a cluster of 50 households were randomly sampled from each selected survey site. A total of 256 survey sites was finally chosen, including about 12000 households and 71000 individuals of all ages. In addition 546 institutional feeding units covering 166 000 individuals were surveyed, including factories, schools, kindergartens and governmental institutions etc.
Household dietary data were collected for 5 consecutive days. The change in the household inventory of food from the beginning to the end of the 5 survey days was assessed. This, and a weighed food survey of items used for preparing meals every day, was adopted to determine the household and institutional level of food consumption. Persons who participated in each meal were recorded in order to calculate the per caput food consumption.
Height, weight, arm circumference and midarm skinfold were measured in a portion of the sampled individuals. A clinical examination, blood and urine tests were also carried out in a small portion of the sampled subjects.
CHNS-89
The 1989 China Health and Nutrition Survey covered eight provinces (Liaoning, Shandong, Henan, Jiangsu, Hubei, Hunan, Guangxi and Guizhou). A multistage, random cluster process was used to draw the sample. Counties in the eight provinces were stratified by income, and four counties were randomly selected (one low-income, two middle-income and one high-income) in each province. Within each county, the township capital was selected and three villages were chosen randomly. In addition to the provincial capital, a lower-income city from each province was also chosen. The whole sample consisted of 188 primary survey sites, including 3780 households and covering about 16000 individuals.
Table 1. Body weight of Chinese adults (CNS-82)
Body weight (kg) |
||||||
Percentiles |
||||||
n |
Mean |
SD |
10th |
50th |
90th |
|
Men |
||||||
All |
6199 |
57.2 |
7.4 |
48.0 |
57.0 |
67.0 |
Urban |
2879 |
58.9 |
7.4 |
50.0 |
58.4 |
68.2 |
Rural |
3320 |
55.8 |
7 2 |
47.0 |
55.0 |
65.0 |
Women |
||||||
All |
7128 |
50.7 |
8.0 |
41.3 |
50.0 |
61.0 |
Urban |
2630 |
52.4 |
8.3 |
43.0 |
51.9 |
63.0 |
Rural |
4498 |
49.7 |
7.7 |
40.6 |
49.1 |
59.0 |
Household food consumption was determined from changes in the food inventory each day in combination with a weighing and measurement technique for foods used by the household for 3 days. In addition, the individual dietary intake was assessed on all children aged 1-6 years and on all adults aged 20-45 years for three consecutive days by a 24 h recall method.
Weight, height, arm circumference
and midarm skinfold were measured for adults aged 20-45 years (in subsequent rounds of
this CNNS panel the anthropometry of all age groups is being collected), and children's
weight and stature were measured.