Introduction
Methods
Results
1. BMI of adults and food consumption: some methodological issues
2. BMI and socio-economic level
3. The effect of age and sex on adult BMIs
4. Adult BMI and morbidity
5. Trends of BMI in Brazil
References
Discussion
M. T. L. de Vasconcellos
Estatistico Consultant, Rio de
Janeiro, Brazil
Brazilian surveys provide an excellent opportunity
to assess the relationship of adult BMI to a variety of social, economic and nutritional
factors. Two surveys are used for the present paper. The first is the ENDEF (Escudo
Nacional da Despesa Familiar) survey conducted in 1974-75 and the second is the PNSN
(Pesquisa Nacional de Saúde e Nutrição) survey of 1989.
Under the technical guidance of the
Food policy and Nutrition Division of the United Nations Food and Agriculture Organization
(FAO), the National Institute of Statistics and Geography of Brazil (IBGE) undertook a
national food consumption and household expenditure survey (ENDEF) in 1974-75. More than
55 000 households were selected and interviewed and their food consumption and expenditure
patterns were carefully monitored during a 1 week period. Many other types of related data
were collected (anthropometry of household members, meal attendance, income and assets,
etc.) and stored in a complex data bank to provide information for the National Accounts
System as well as for other users (agriculture, health and social sectors).
The ENDEF survey
This is a food consumption and family budget survey planned within the setting of the National Accounts to provide estimates for the expenditure on goods and services in the family sector. The survey also provides a substantial set of social indicators of the Brazilian population and the structure for several consumer price indices in the country. The nutritional objectives of the ENDEF survey were considered to be part of the social indicators which IBGE was developing at that time.
The ENDEF household survey used a non-self-weighted probabilistic sample of about 55000 households with about 230000 individuals and was designed to provide estimates appropriate to 22 geographical areas. The data were collected from August 1974 to August 1975 by almost 1000 enumerators divided into about 200 teams each headed by a supervisor. Each household was surveyed for 7 consecutive days with three or four daily visits (according to the number of meals prepared in the day) to weigh the food items that would be consumed in the next meal, their non-edible parts, as well as the food items purchased and the food items classified as 'waste', i.e. food not consumed and to be thrown out, given to domestic animals, given to other families or retained and consumed after the survey period in the household. For some food items, such as sugar, salt, seasonings, coffee etc., it was also necessary to weigh the family's stocks in order to estimate their consumption during the meal by taking the differences between the weights before and after the meal.
The visits were also used to record information, such as the attendance of residents and non-residents (guests, domestic employees, etc.) at the meals prepared, the household composition, individual data (sex, age, education level, weight, height, arm circumference, etc.) and the daily expenditure on food purchases, meals taken away from home, transport cigarettes, newspapers, etc.
After 3 or 4 days of survey, i.e. after gaining the family's confidence, the enumerator started collecting the data on family expenditure according to different recall periods (I month, 3 months and 1 year). On the final visits questions were asked about family income and savings. Using such methodology, it was possible to collect a set of very high quality data on food consumption as well as on household income and expenditure.
The information was recorded in a specially prepared questionnaire. Such data were then reorganized after entering and editing, in order to accommodate better the analysis. Some steps of the data reorganization will be mentioned in the following sections.
The PNSN survey
The second survey, Pesquisa Nacional de Saúde e Nutrição (PNSN), was a national health and nutrition survey carried out in 1989. It was conducted by IBGE at the request of the Instituto Brasileiro de Alimentação e Nutrição (INAN), the Brazilian Institute for Food and Nutrition that planned the survey, developed the questionnaire and supported most of the survey budget.
PNSN is a household survey with a
non-self-weighted probabilistic sample of about 60000 individuals and 17 000 households,
designed to provide estimates for nine geographical areas. It was a one-visit survey that
collected data on household and individuals' characteristics. The individual data
collection was divided into seven groups: general information; employment and income;
education and attendance at school; children's information; women's information;
morbidity; and anthropometric measures for everybody.
As the two surveys were not self-weighted, the
results had to be weighted by the appropriate sample expansion factors (sample weights).
The results presented are based on ENDEF food
consumption data and the steps to create the variables used are summarized below.
All the food item weights used were as consumed, i.e. they took account of wastage by several routes. These daily weights of food items in each household were aggregated for the survey week to generate the weekly food consumption of the family. These weights were then transformed into kilocalories and nutrients by using a food composition table.
The consumption in kilocalories of each meal in each set of daily meals provided a scale of the significance in energy terms of each meal. To explain the scale, the set of three meals most commonly eaten by Brazilian adults and the set of four meals eaten by children and the elderly are presented below, since the pattern of meal consumption accounted for more than 95% of the meal patterns observed in the survey. The following scores for the daily energy content consumed at each meal for the two mentioned patterns were as follows:
Adults: |
Children: |
breakfast 18% |
breakfast 16% |
lunch 49% |
lunch 43% |
dinner 33% |
third meal 11% |
dinner 30% |
Using the complete scale and the daily records of those individuals attending at meals it was possible to create for each person an index of attendance at meals, i.e. the sum of all his/her daily indexes. This index varies from 0 (somebody absent from all meals during the survey week) to 7 (somebody present at all meals).
This index is very useful for normalizing the individuals' attendance at meals since it takes into account the differences in food pattern, i.e. the set of meals taken in a day by individuals and the differences in daily meal pattern for the same person. The absence of family members from meals at home was also clear as well as the presence of guests at the family meals. The proportion of food eaten out of the home was also available.
Since the index of attendance at meals does not take account of differences in the age and sex of the individuals within the family, an 'equivalent adult' scale was developed, based on the average energy requirements of each sex and age group. The standard unit is a man of 20-29 years old, of 63.9 kg and with a height of 1.69 m. Each individual received a proportional score based on this standard and depending on the energy requirement estimated from the age and sex of the household member according to his/her sex and age.
For each family the total of adult equivalent consumers is the product of the meal attendance index of each individual multiplied by his/her respective adult energy equivalent score.
The per adult energy intake of the family is assessed by dividing the family intake of energy by the total of adult equivalent consumers.
To better understand the results presented, the concept of energy adequacy is defined as the ratio between the family intake in kilocalories and the family's energy requirements. The related family energy requirement is obtained from the sum, for all consumers, of the products of the individual's daily energy requirement multiplied by the individual's index of attendance at meals. In this way the intake consumed at the recorded meal times is related to the equivalent proportion of the family's expected weekly energy requirement.
As the survey was done in 1974-75, the estimates of the energy requirements do not follow the later FAO/WHO/UNU 1985 recommendations. We have therefore limited the analysis to the estimated minimum energy requirement and therefore to the minimum energy adequacy ratio.
A comparison between family variables, such as intake, adequacy ratio or income, and individual variables, such as BMI, presented some difficulties because individuals with different BMIs as well as children contribute to the family data. A number of issues emerged when trying to cope with this problem. First, controlling or monitoring food distribution within the household was almost impossible: in very poor Brazilian families food is first given to those who work and provide money, i.e. the adults, generally males, or the older sons, while in the families of medium income level the intrafamilial food distribution is most favourable to the children.
Secondly, when undertaking large surveys which include families with particular problems, it is difficult to collect data without introducing errors. This in turn introduces considerable random noise in the statistical analysis.
Thirdly, the sample size of more than 130 000 adults limits the use of several statistical techniques which are designed for small samples. For example, a regression between food consumption (in value, quantity or energy terms) and income (or expenditure) for the 55000 family points will not fit any of the well-known Engel's curves. But aggregating such information into 20 equal size groups, defined by the mean income and the mean consumption in each class, and then performing the regression procedure over the 20 points allows all the curves and consumption behaviours described in the literature to be shown.
To show the effect of all these aspects, the Pearson's correlation matrix for four variables (per adult energy intake, minimum energy adequacy ratio, family total expenditure and BMI) was estimated over the 130 000 individual points. Table 1 shows that there are very low linear correlations among the variables except for two family level variables: per adult energy intake and minimum energy adequacy ratio.
In view of these findings, it was decided to use another statistical approach, creating class variables and analysing the data with multivariate statistical methods. Classes of all variables were created with a minimum sample size to guarantee the precision of the estimates produced. For the case of BMI classes, the cutoff points as defined by James, Ferro-Luzzi & Waterlow (1988) were used.
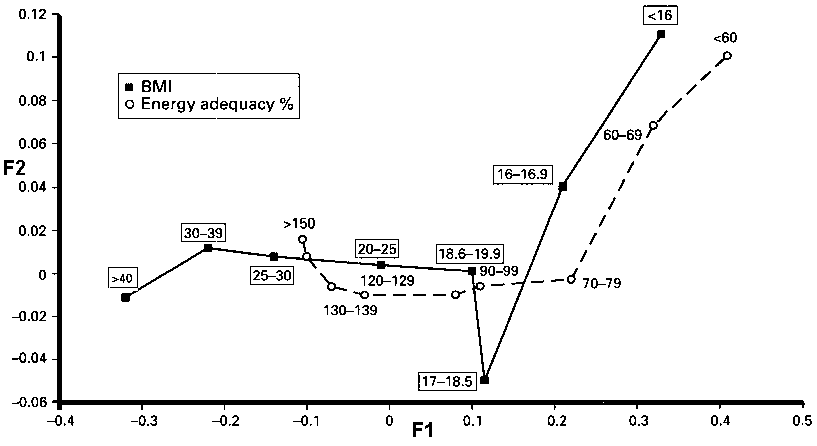
Another table (not presented) also sets out the relationship between the minimum energy adequacy and BMI. In order to show graphically the meaning of the values in this table, the multivariate statistical method of principal components analysis was used to perform an orthogonal projection to a two-dimensional space, called the principal plane. The two principal components were normalized to have a mean of zero and a standard deviation = 1; they constitute the vectorial bases of the principal plane. To plot the barycentre of each class in the principal plane, the statistical method known as 'analysis of correspondence' was used.
Table 1. A Pearson's correlation matrix of data from the ENDEF survey
Correlation coefficient |
||||
Variable |
Energy intake |
Adequacy of intake |
Family expenditure |
BMI |
Per adult energy intake |
+1.000 |
+0.944 |
+0.049 |
+0.114 |
Minimum energy adequacy |
+0.944 |
+1.000 |
+0.024 |
+0.101 |
Family total expenditure |
+0.049 |
0.024 |
+1.000 |
+0.078 |
BMI |
+0.114 |
+0.101 |
+0.078 |
+1.000 |
Although the details of the multivariate statistical methods used might be difficult for professionals from other backgrounds, the interpretation of the graphics is very easy: class points (or barycentres) which are close together have a high correspondence (or correlation) while class points distant from each other have a low correlation.
Figure 1 shows that BMI classes and minimum energy adequacy classes describe two curves that go in the same direction, from low BMI and low adequacy to high BMI and high adequacy: the family energy adequacy classes are related to individuals' BMI classes. Thus, the probability of a thin person being in a family of low energy adequacy is greater than being in a family of high energy adequacy. Conversely, the probability of having a fat person in a family of low energy adequacy ratio is smaller than in a family of high energy adequacy ratio.
Figure 2 presents an analysis of correspondence plot in the principal plane, showing the relationship between the per adult energy intake and BMI class. Here again, and despite problems with comparing a family level variable with an individual one, there is a good correspondence between intake and BMI. The two curves go in the same direction from low intake and low BMI to high intake and high BMI. Individuals with low BMI tend to be in those families with low energy intakes, while obese people are more frequent in those families with high calorie intakes (expressed in terms of per adult equivalent intakes of energy).
All the results presented have been
weighted by the sample weight and therefore are estimates for the whole Brazilian adult
population and not just for the sample.
The results presented in this section are based on
ENDEF data and the main definitions are given below.
The total family expenditure is the sum of monetary and non-monetary expenditure, i.e. home production, donations received as goods, the exchange of goods, the estimated rental value of an owned house, etc. It includes current expenditure, the active increase, i.e. purchase of non-transferable goods and expensive durable goods, and the passive decrease, i.e. expenditure by the payment of debts or lending. All these variables have been deflated to February 1975 prices. This is the best proxy of family total income. Decile classes were constructed to represent (10% of the Brazilian adult population.

A table of BMI classes and the docile of family total expenditure was constructed first and then a graphic representation of the frequencies was created using the same multivariate statistical methods as mentioned in the previous section. Figure 3 shows the effects of income (expressed as the family's total expenditure) on BMI. At low income levels there is a higher probability of having a thin individual and when income increases the probability decreases. It is noteworthy that the trend observed from the first to the ninth docile (as income increases, BMI also increases) is broken between the ninth and the tenth docile. This could be explained by the fact that at this level of income the individuals are conscious of their weight gain and have responded by reducing their BMI.
Socio-professional categories were also defined for each individual by considering four variables: occupation, the nature of the establishment where the person works, his/her position in the occupational categories (employer, self-employed, employee, etc.) and his/her education level. For the primary economic sector (agriculture and cattle breeding) three occupational categories were defined: employer, self-employed and employee. For the other two economic sectors (industry and services) the categories were defined, as listed in Table 2.
For non-economically active individuals five categories were defined as: (a) non-active with income; (b) housewives; (c) non-active children aged 18 years only since the BMI estimate is limited to the adult population; (d) non-active of 19-60 years; and (e) non-active of >60 years.
Figure 4 represents the barycentres of the BMI classes and the individual's socio-professional group. Thin people are more frequently found in rural areas (employees and self-employed in agriculture and in family business, with a low income and a high physical activity level), when young or old or when they were non-active despite being in the age range when activity is to be expected. This generally therefore meant adults with psychological or physical problems.
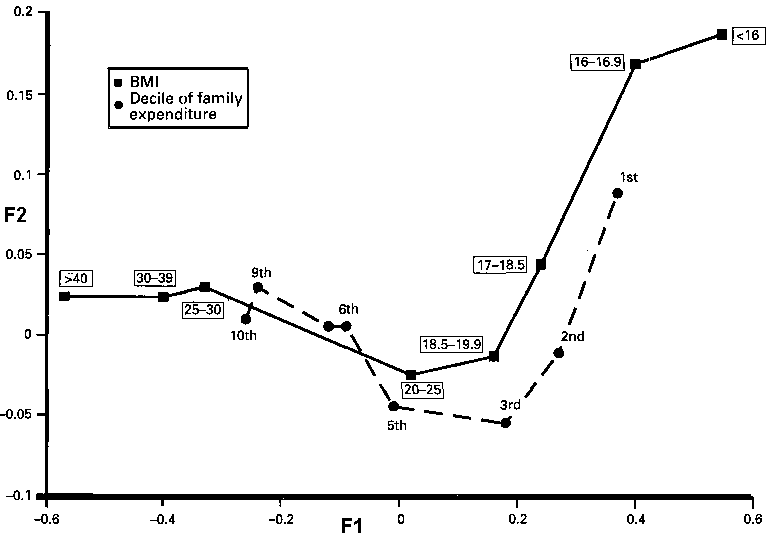
Table 2. The categories used in classifying occupational groups
Employer in industry |
Clerical employees |
Employer in commerce and services |
Employees in commerce |
Self-employed |
Domestic employees |
professional, e.g |
Workers in services |
physician, lawyer |
Police, army, navy, air force, etc |
Self-employed in formal commerce |
Individuals from arts and sports |
Self-employed in informal commerce |
Catholic priests, ministers, etc |
Self-employed workers informal services |
Individuals in a family business (employee of a family member, receiving no wage
and found most in rural areas) |
Self-employed workers in informal services |
|
university graduated employees |
|
School teachers |
|
Other medium education level employees |
The great majority of the socio-professional categories are in the normal range of BMI and distributed according to each category's income and physical activity level. The BMI of housewives, of priests and ministers of religion and of inactive persons with an income are more frequently met in the BMI class of 25-30 than other categories. Extreme values of BMI (<16 and >40) are not specific to any socio-professional category.
An analysis was also made (data not shown) of the relation of BMI classes to the regional distribution of the adult population. Thin individuals are more frequent in the poorest Brazilian regions of the North and Northeast, while normal to overweight individuals are mostly in the richest regions of the country of the Southeast and South.
Income was not enough to explain the
BMI differences of adults and there is a sex difference in the effect of the regional
location of the adults. In the poorest regions women are thinner than men, while in the
richest regions the probability of having a fat woman is higher than having a fat man.
With the ENDEF data, two tables and two plots of
analysis of correspondence relate BMI with age and with sex and age. They show how age
describes a curve around three BMI barycentres (17-18.5, 18.51-20 and 20.01-25). Young
people have a greater probability of being thin, and such probability decreases according
to age until 50-59 years and then increases again in the older individuals. The effect of
age is similar for both sexes, although women tend to have greater BMI than men in all
ages after 25 years.
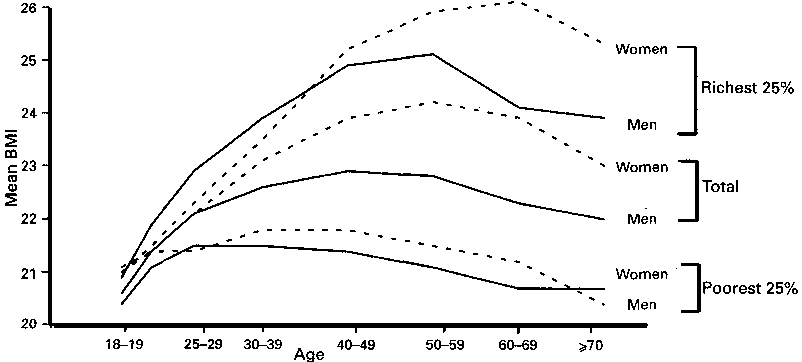
Curves of mean BMI by age, sex and income level describe the same pattern found in the above-mentioned plots (not shown). Figure 5 shows changes in mean BMI according to age groups, sex and income level. These data highlight the same general upward trend in BMI until middle age, but demonstrate that the values for the average obscure marked differences in the response of adults from rich (top) and poor households (bottom).
At 18-19 years there is no BMI significant difference by sex and income level. Adults of the poorest 25% are thinner than those of the richest 25% (see also Fig. 3) and, in general, men are thinner than women. However, for the richest 25% of the adult population, women are, on average, thinner until 40 years. In the poorest 25% of the adult population women are also, on average, thinner from 25-29 years and after 70 years. These figures also show that the income effect on BMI is more important than the sex effect and that the sex effect becomes important after 25 years.
The PNSN survey
This survey, conducted in 1989,
showed the same trends of BMI by sex, age and income level as those presented here for the
ENDEF survey 15 years earlier. The PNSN survey did, however, allow some further analyses
to be made.
When BMI was analysed according to whether or not
the adults smoked, the expected relationship was found. Cigarette smokers had a higher
probability of being thinner than non-smokers. For pipe and cigar smokers the sample size
was too small to reach any conclusion. Both male and female cigarette smokers are thinner
than non-smokers.
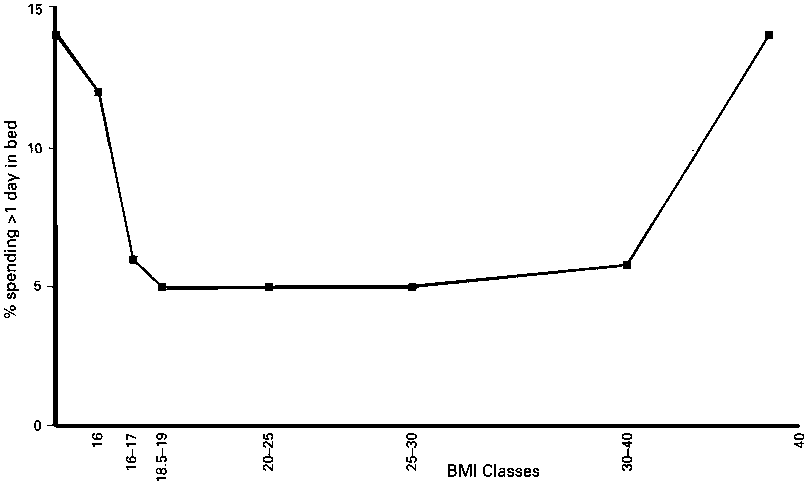
The PNSN survey also provides the opportunity of linking the BMI of individuals with their morbidity assessed in a variety of ways. Figure 6 shows the relationship in adults between their BMI and the number of days spent in bed during the 2 weeks before the survey. There is a U-shaped curve in morbidity similar to that often published of the mortality curve of BMI in Western societies. This means that thin as well as obese people have a greater probability of staying in bed than normal individuals.
It is noteworthy that there is a
modest increase in morbidity for the 16.0-17.5 BMI category but the second category of
16.0-17.0 shows a marked increase in morbidity. When each condition leading to their
morbidity was assessed it was assumed that febrile episodes and diarrhoeal disease would
feature prominently in the causes of the morbidity because these are the two prominent
features in malnourished children. In practice, neither fever nor diarrhoeal disease
contributed to their morbidity but upper respiratory tract infections were common.
The trends of BMI in Brazil can be shown by using
both the ENDEF (1974-75) and PNSN (1989) data. In the 15 years interval the nutrition
status of the adult population, as measured by BMI, has changed appreciably, with a
decrease in the number of undernourished individuals (BMI <18.5) and an increase of
those in the number with a BMI >25.
Figure 7 shows the differences in the percentages of the population according to BMI classes at both surveys. The first two BMI classes, as well as the last two, were aggregated, for ease of comparison.
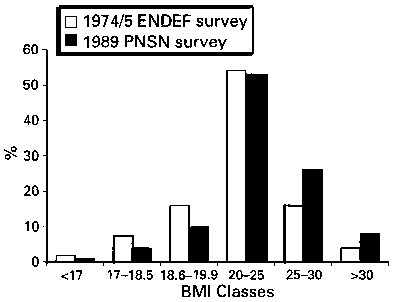
Factors responsible for such significant changes as well as their respective importance are not easily identified: a decrease in physical activity level, an increase in income, better food availability with a fall in food prices, an improvement in housing conditions and services etc. These are probably the most significant factors. The next national food consumption and family budget survey will give detailed answers to these questions.
Acknowledgements - I would
like to thank Mr John R. Lupien, Director, Food Policy and Nutrition Division and the
Nutrition Planning, Assessment and Evaluation Service, as well as Professor Philip lames,
Director, Rowett Research Institute, Aberdeen, for their technical support in developing
and presenting these new approaches to assessing malnutrition and poverty. The opinions
expressed in this document are those of the author and do not necessarily represent those
of the Food and Agriculture Organization.
James WPT, Ferro-Luzzi A & Waterlow JC (1988):
Definition of chronic energy deficiency in adults. Report of a Working Party of the
International Dietary Energy Consultative Group. Eur. J. Clin. Nutr 42, 969-981.
FAO/WHO/UNU (1985): Energy and
protein requirements. Technical Report Series 724. Geneva: World Health Organization.
Allen: Is there a difference in BMI between
blacks and whites?
Vasconcellos: Yes, generally black people are poorer, so it is an effect of income, not colour. Naidu: The North has a population with a low BMI. If you look within the same occupational and economic group, are there any racial differences?
Vasconcellos: The data do not
allow this analysis. The North is more rural and mainly agricultural. In the South we have
more industry and service people. Socio-professional stratification and income shows a
high correlation with urban and rural areas, so we would not compare this variable. In
trying to look at income levels there is also a problem that the same amount of money does
not buy the same amount of food in different regions of Brazil.