3.1. History
3.2 Sample requirements
3.3 Isotope ratio measurements
3.4 Water standards
3.5 Sample preparation
3.6 Mass spectrometer accessories
3.7 Required precision of isotopic analyses
3.8 Sources of 2H- and 18O-labelled water
3.9 Preparation of water tracer for human consumption
3.10 Deuterium and 18O enrichments of the dose
3.11 Concluding remarks
3.12 References
Contributors:
William Wong
Dale Schoeller
Gas-isotope-ratio mass spectrometry (GIRMS) is considered to be the best analytical technique for the accurate and precise measurement of 2H and 18O content in physiological samples. The first GIRMS was described by Neir in 1940 1. The mass spectrometer consisted of an ion source, a permanent magnet, and a single collector. The vacuum of the mass spectrometer was maintained with a two-stage mercury diffusion pump. Gas sample was admitted into the ion source through a capillary leak. The gas molecules were ionised with electrons in the ion source and the positively charged molecules were propelled by an accelerating potential into the magnetic field where they were resolved into separate ion beams according to their masses. Because a single collector- was used, the isotope ratio of the sample was measured by alternate focusing of each ion beam onto the collector after the adjustment of the ion accelerating voltage. Subsequently, a dual-collector for simultaneous measurements of the ion currents of two isotopic masses 2, 3 and a dual inlet system 4 for alternate introduction of a sample and a standard gas into the mass spectrometer were incorporated into the Nier-type mass spectrometer.

The basic design of the
Nier-McKinney-type mass spectrometer persists in gas-isotope-ratio mass spectrometers
today. With advances in electronic, vacuum and computer technologies, however, the present
day instruments are fully automated and considerably more sensitive. A schematic diagram
showing the general arrangement of the gas-isotope-ratio mass spectrometers used today is
shown in Figure 3.1. After the sample and standard gases have been admitted into the inlet
system, the entire process of valve sequencing, pressure matching between the sample and
standard gases, ion source tuning and focusing, vacuum monitoring, and data collection and
reduction is controlled completely by computer. Multiple collectors can be fitted to the
mass spectrometer to measure the ion beam currents of different masses (eg 44, 45 and 46
for 12C16O, 13C16O2 or 12C16O17O
and 12C18O16O) simultaneously. For hydrogen isotope ratio
measurement, a split-flight tube with a separate dual collector system can be fitted onto
the same instrument. Therefore a single instrument with a single ion source can be used
for both hydrogen and oxygen isotope ratio measurements.
3.2.1 Sample-form requirements
Samples must be in a gaseous state before they are introduced to the ion source of the mass spectrometer. For hydrogen isotope ratio measurement, physiological fluids must be converted to hydrogen gas. For oxygen isotope ratio measurement carbon dioxide was initially the preferred sample gas, but with the introduction of the twin mass spectrometer system, the oxygen-18 content of fluid samples can be measured directly from water vapour. This allows a constant sample flow, reduces problems with memory effects and minimises isotopic interference.
3.2.2 Sample-size requirements
The amount of sample required for
measurement is related to the ease with which the sample can be transferred into the inlet
system of the mass spectrometer. Hydrogen gas is difficult to transfer cryogenically.
Therefore, for hydrogen measurements, approximately 20 mmol of H2 is required. Carbon dioxide can be
transferred easily with liquid nitrogen. Therefore, for accurate and precise oxygen
isotope ratio measurements, as little as 0.5 mmol is sufficient. With the twin mass spectrometer system,
as little as 55 mmol
of H2O is required for simultaneous hydrogen and oxygen isotope ratio
measurements.
3.3.1 Units of measurement
The sensitivity of gas-isotope-ratio mass spectrometer measurements is achieved by comparing the isotopic abundances of the sample to that of a standard under identical measurement conditions. Results are expressed in relative delta (d) per mil (‰) units which are defined as follows:


where d2Hws and d18Ows are the delta values of the sample measured relative to the laboratory working standard (ws) and (2H/1H)ws and (18O/16O)ws represent the hydrogen and oxygen isotope ratios of the laboratory working standard respectively.
The natural abundances of 2H/1H and 18O/16O can be measured with instrument precisions (2 SDs, n = 10) of 0.1‰ and 0.03‰ respectively.
3.3.2 Normalisation
For ease of comparison, these 2Hws and 18Ows values are normalised against two international water standards: Vienna Standard Mean Ocean Water (V-SMOW) and Standard Light Antarctic Precipitation (SLAP) as d Standard Light Antarctic Precipitation (SLAP) as follows 5:

where dsample/ws' dV-SMOW/ws' and dSLAP/ws are the d2H or d18O values
of the sample, V-SMOW, and SLAP measured relative to the working standard respectively.
For 2H/1H and 18O/16O isotope measurements dV-SMOW
defined as zero and d°SLAP has values of -428 and -55.5 ‰ for 2H
and 18O respectively.
3.3.3 Atom percent and part per million units
The relative delta per mil values are convenient for expressing very small differences in 2H and 18O content. However, with high enrichment levels of these isotopes in tracer studies, the results may be expressed more conveniently in terms of atom percent (atom %) or parts per million (ppm). By definition:
atom % = fractional abundance x 100
ppm = fractional abundance x 106
Fractional abundance (C) for deuterium is calculated from the delta per mil value as follows:
![]()
![]()
![]()
where R is the 2H/1H ratio of the sample, d is the normalised d²H value of the sample, and RV-SMOW is the 2H/1H ratio of V-SMOW which has a value of 0.00015595 6.
Fractional abundance of 18O is calculated from the delta per mil value as follows:
![]()
![]()
![]()
![]()
![]()
Where 17R and 18R'
are the 17O/16O and 18O/16O ratios of the
sample, d
is the normalised d18O value of the sample, and 17RV-SMOW
and 18RV-SMOW are the 17O/16O and 18O/16O
ratios of V-SMOW which have values of 0.000373 7 and 0.002005 8
respectively.
The international water standards,
V-SMOW and SLAP, can be purchased from the International Atomic Energy Agency, Section of
Isotope Hydrology, Wagramerstrasse 5, P.O. Box 100, A-1400 Vienna, Austria. Other water
standards: Greenland Ice Sheet Precipitation (GISP), IAEA-302 (d2H: 500 and 1000
‰ vs V-SMOW), and IAEA-304 (d18O: 250 and 500 ‰ vs V-SMOW), can also be
obtained from the same agency.
3.5.1 Hydrogen isotope ratio measurements
3.5.1.i Uranium reduction
For hydrogen isotope ratio measurements, water in physiological fluids must: be converted to hydrogen gas prior to mass spectrometric analysis. Conversion of water to hydrogen gas by passage over uranium art approximately 600°C follows the reaction:
H2O + U (r) UO2 + H2
The reduction is usually performed within a vacuum line. Uranium metal, is obtained as turnings and is prepared for use by cutting the turnings into 1 cm lengths, degreasing with propanol and immersing them in concentrated nitric acid to remove surface oxidants. Because hydrogen gas is non-condensable at liquid nitrogen temperature it produced is compressed into a sample bulb/tube with a mercury Toepler pump. Complete reduction of the water and collection of the hydrogen gas is crucial to avoid isotope fractionation. Since samples of different 2H enrichments are passed through the same uranium furnace a memory effect occurs. This is best minimised by flushing the line once or twice with the next sample prior to collection of the hydrogen gas for analysis. Precision of the preparation ranges between 0.5 and 2 ‰.
3.5.1.ii Zinc reduction
Water can alternatively be reduced to hydrogen with zinc at 450°C according to the following reaction:
H2O + Zn (r) ZnO + H2
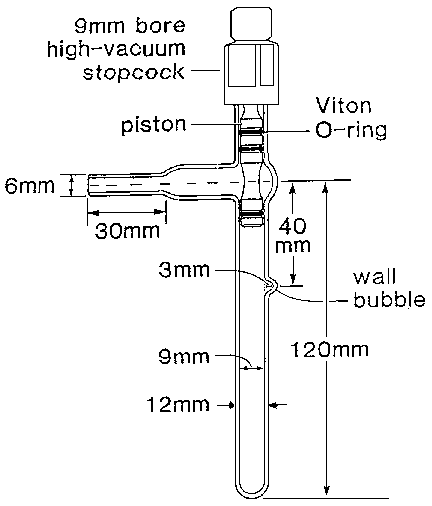
Approximately 250 mg of <1 mm cleaned AnalaR zinc shot is transferred to a quartz reaction vessel (Figure 3.2). The vessel is evacuated to <10-4 mbar and then filled with dry nitrogen. With the nitrogen flowing at approximately 50 ml/min, the stopcock of the vessel is removed and 10 mg of physiological fluid is placed at the wall bubble of the vessel using a micropipette. Immediately, the stopcock is replaced and the sample is frozen with liquid nitrogen. The vessel is again evacuated to 10-4 mbar. The water in the sample is reduced to hydrogen by heating the zinc shot to 450°C for 30 min 9. After cooling to room temperature the hydrogen is ready for isotope ratio measurement without further purification. Memory effect is minimised using this procedure because a fresh aliquot of zinc shot and an individual reaction vessel is used for each reduction. At natural abundances the deuterium values are accurate to -0.2 ± 1.2 ‰ (SD, n = 68) and reproducible within 1.2% (SD). At 600 ‰ the values measured from plasma, urine, saliva and human milk samples are accurate to -4.3 ± 4.8 ‰ (n = 200) and reproducible within 3.2 ‰ (SD).
3.5.2 Oxygen isotope ratio measurements
3.5.2.i H2O-CO2 equilibration
The 18O content of aqueous fluids can be measured by equilibrating the sample with CO2 of known 18O content according to the following reaction 10:
H218O + C16O2 (r) H216O + C16O18O
At the end of the equilibration, the CO2 is isolated and purified from the equilibration vessel for isotope ratio measurement. The 18O content of the water is calculated according to the following equation:
![]()
where d18O is the 18O content of the sample; d18OO and d18Ot are the 18O content of the CO2 before and after the equilibration respectively; a is the isotope fractionation factor between CO2 and H2O and has a value of 1.0412 at 25°C 11; and k is the ratio of oxygen atoms between the water sample and the CO2. When k is >800, correction for isotope fractionation becomes negligible. A sample size of approximately 0.5 g is sufficient for the equilibration procedure. The precision of this equilibration method ranges from 0.01 to 0.6 ‰ (SD).
3.5.2.ii Guanidine hydrochloride conversion
When sample size is limiting, the guanidine hydrochloride method is appropriate for the conversion of 1-10 mg of H2O to CO2 for oxygen isotope ratio measurement 12. Water is quantitatively converted to CO2 with guanidine hydrochloride at 260°C for 16 h according to the following reaction:
![]()
![]()

A diagram showing the reaction assembly is shown in Figure 3.3. Upon cooling, ammonium carbamate is formed as follows:
![]()
![]()
The CO2 is released from the ammonium carbamate by heating the reaction assembly at 80°C for 1 h in the presence of 100% H3PO4. The NH3 released from the ammonium carbamate at 80°C is removed by H3PO4 as follows:

At the end of the incubation, the CO2 is transferred to a sample bulb for isotope ratio measurement.
Using this method a precision of
0.08 ‰ was obtained for 18O values measured from water samples with
natural abundances of 18O. At natural abundances, the d18O values of
biological fluids (saliva, urine, plasma, human milk) were reproducible to within 0.16
‰ and accurate to within 0.11 ± 0.73 ‰ (mean + SD) of the H2O-CO2
equilibration value. At a 250 ‰ enrichment level of 18O the d18O values
of these biological fluids were reproducible to within 0. 95 ‰ and accurate to 1.27
± 2.25 ‰.
Nutritional and biomedical applications of stable isotopes often require the ability to process many samples in a day. In order to increase sample throughput and optimise instrument usage, a number of accessories have been designed to operate in conjunction with the gas-isotope-ratio mass spectrometer without operator intervention.
3.6.1 Multiple sample inlet system
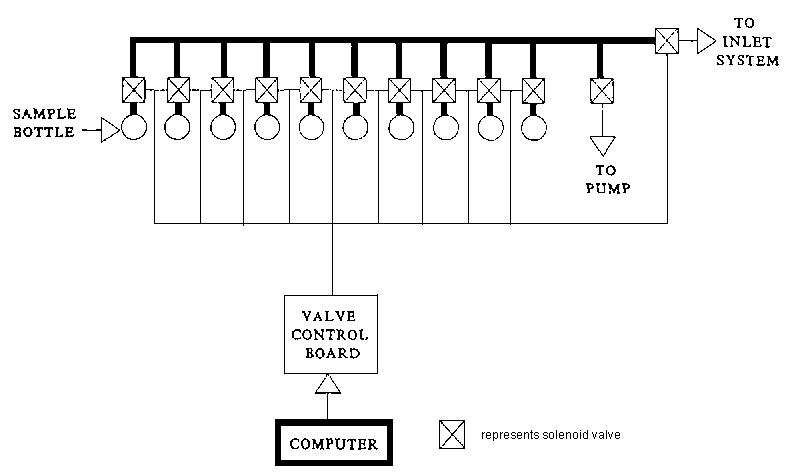
A multi-sample inlet system (Figure 3.4) permits unattended sequential analysis of up to 50 samples. Sample bottles containing the gas samples (H2 or CO2) are attached to the solenoid valves with vacuum connectors. The manifold and the connections between the solenoid valves and the stopcocks of the sample bottles are evacuated to a preset vacuum level before sequential expansion of each gas sample into the inlet system of the mass spectrometer for analysis. Precision of £ 0.1 ‰ (SD, n = 10) can be obtained using the multiple sample inlet for CO2 analysis. For 2H/1H isotope ratio measurements precision of approximately 0.5 ‰ can be expected.
3.6.2 Automatic cold finger
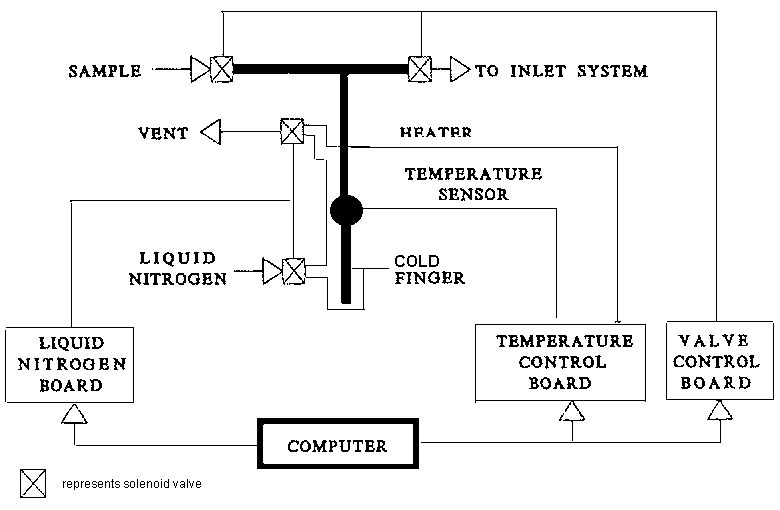
In working with small samples of CO2, the automatic cold finger (Figure 3.5) allows cryogenic transfer of the gas sample from an inlet system into the cold finger with liquid nitrogen. A gas sample as small as 0.05 mmol can be transferred and analysed with high precision and accuracy. The entire process of cooling, heating and valve sequencing is controlled by the computer. Precision of 0.01 ‰ and 0.03 ‰ can be obtained for 13C and 18O isotope ratio measurements respectively.
3.6.3 Breath CO2-purification system
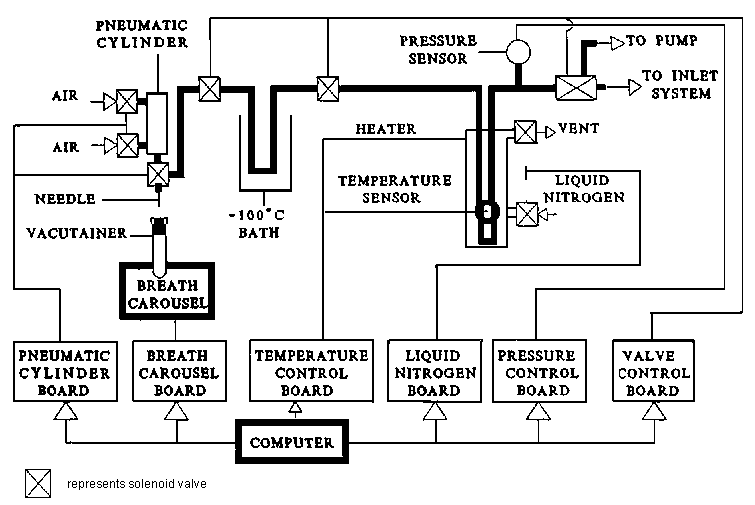
A breath CO2-purification system is shown in Figure 3.6. This system can be used for purification of CO2 used in the H2O-CO2 exchange reaction for the measurements of oxygen isotope ratios in physiological fluids. The system consists of a sample carousel, a pneumatic-cylinder system for puncture of the septum of a vacutainer, and a cryogenic purification system. Water vapour is removed by the -100°C trap, CO2 is condensed in the liquid nitrogen trap and non-condensable gases are pumped away. Up to 50 samples can be processed sequentially with this system with a precision of 0.2 ‰
3.6.4 Water/carbon dioxide equilibration system
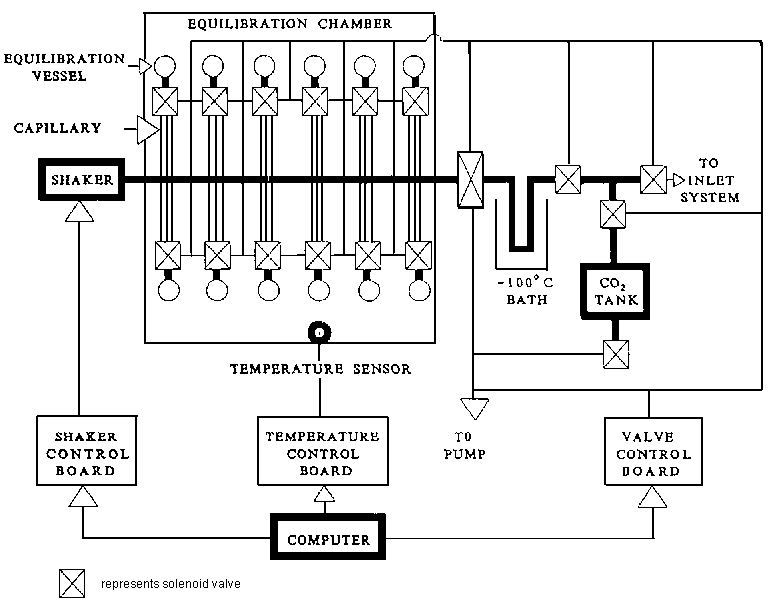
The H2O-CO2 equilibration system (Figure 3.7) is used to measure 18O/16O ratios in aqueous samples. The system utilises the difference in pumping speeds between gas molecules passing through a capillary to minimise the loss of water sample. Therefore, there is no need to freeze the water sample before the equilibration vessel is evacuated and CO2 is admitted, or before the CO2 is extracted after equilibration for isotope ratio measurement. Up to 48 samples can be accommodated. As little as 0.1 g of biological fluid is sufficient for accurate and precise oxygen isotope ratio measurements 9. The entire sequence of evacuation, CO2 addition, shaking, temperature control, CO2 extraction and isotope ratio measurement is controlled by computer.
With water samples at natural abundances the 18O/16O ratios were accurate to - 0.05 ± 0.50 ‰ (mean ± SD, n = 52) and reproducible within 0.21 ‰ With biological samples at 250 ‰ an accuracy of -0.32 ± 0.87 ‰ (mean ± SD, n = 200) and a precision of 0.97 ‰ was obtained.
3.6.5 Dual isotope injection system
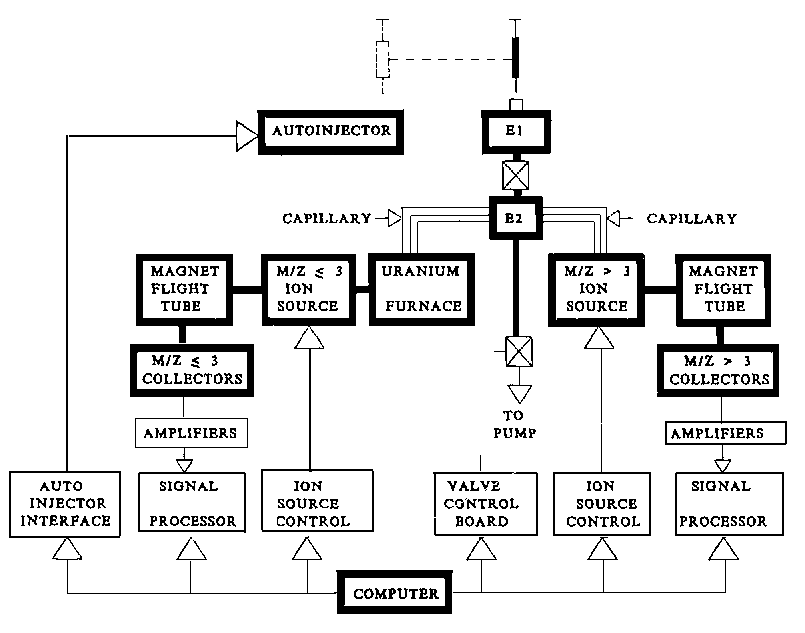
A twin mass spectrometer system 13 for simultaneous measurements of 2H/1H and 18O/16O ratios in aqueous samples is shown in Figure 3.8. Approximately 1-5 mg of sample is injected into the expansion chamber, E1. After vaporisation, the water vapour is allowed to expand into expansion chamber, E2. A portion of the water vapour travels through a capillary into a uranium furnace at 620°C and is reduced to H2. The H2 enters the m/z £3 ion source and is ionised to 1H2+ and 1H2H+ ions for hydrogen isotope ratio measurements. At the same time, another portion of the water vapour travels through the other capillary and enters the m/z ³3 ion source, forming 1H216O+ and 1H218O+ ions for oxygen isotope ratio measurements. To maintain the water in vapour phase, the expansion chambers, the capillaries and the m/z £3 ion source are maintained at 150°C. Since the same paths are used by samples of different isotopic enrichments, multiple injection of the same sample is required in order to eliminate or to correct for memory effect. Correction for underestimation of deuterium enrichment by the twin mass spectrometer system is also necessary. At natural abundances of 2H and 18O, the 2H/1H and 18O/16O ratios can be measured with a precision of 1.1 ‰ and 0.4 ‰ respectively.
