A hypothetical model for
considering protein-energy interrelationships during starvation
is illustrated in Figure 3. At the time of death, a 70 kg
man with 9 kg initial fat (13% body fat) and 12.2 kg protein (87%
fat-free mass) loses most of his fat (8 kg) and only 4.6 kg
protein (these values are based on autopsy findings of subjects
who died of starvation). For simplicity changes in glycogen are
ignored because they make little quantitative difference to the
calculations. Assuming that the metabolizability of endogenous
protein and fat is close to 1.0 (energy densities 4.44 and 9.40
kcal/g, respectively [ELIA and LIVESEY, 1992]), the total
available energy is less than 100000 kcal, with 79% being derived
from fat (Figure 3). If the mean daily energy expenditure
of such an individual is 1500 kcal/d, survival time would be 64
days, which is similar to the actual values reported for lean
individuals (Table 3).

Table 3. Effect of obesity on survival time during 'total' starvation in mice and humans
Survival time (days) |
Author |
|
Mice (8 weeks old) |
||
Lean |
||
Winter |
4 days |
CUENDET et al., 1975 |
Summer |
8 days |
CUENDET et al., 1975 |
Obese (ob/ob) |
||
Summer |
>28 days |
CUENDET et al., 1975 |
Humans |
||
Lean |
||
(n=9) |
57-73 days |
Northern Ireland Fasters* |
(n = 1) (prior gunshot wound) |
43 days |
Northern Ireland Faster* |
(n=1) |
63 days |
MEYERS, 1917 |
Obese (successful
fasts) |
||
(n= 1) |
382 days |
STEWART and FLEMING, 1973 |
(n=1) |
249 days |
RUNClE and THOMSON, 1970 |
THOMSON et al., 1966 |
||
COLLINSON, 1967 |
||
(n=1) |
210 days |
RUNClE and THOMSON, 1970 |
Several |
100-200 |
DRENICK et al., 1964 |
RUNCIE and THOMSON, 1970 |
||
THOMSON et al., 1969 |
||
* From Newspaper reports (see also LEITER and MARLISS, 1982).
Furthermore, there is great similarity in this model with the changes which occurred in an American tailor who refused all food for 60 days and who died on the 63rd day (MEYERS, 1917). During his starvation only water was drunk except during the last 3 days when he took a small amount of nourishment. His initial body weight was 61.4 kg and height 1.72 m (BMI 20.75). At the time of death, his weight was 36.4 kg, and BMI 12.30 (death from starvation/semi-starvation frequently occurs when subjects reach a final BMI of 10-14 [e.g., HENRY, 1990; KEYS et al., 1950]). The autopsy of this man revealed that his body was virtually free of fat. If it is assumed that this body initially contained 8.1-10.1 kg fat (calculations based on the weight and height formulae of GARROW and WEBSTER (1985) and BLACK et al. (1983), respectively) and that the final body fat (structural plus storage) was only about 1 kg, it can be deduced that loss of body fat accounted for 28-36% of the weight loss and fat-free mass 64-72%. Furthermore, if the fat-free tissue that was lost contained 32 g N/kg, it can be calculated (neglecting loss of energy in urine and breath as ketone bodies) that his average daily energy expenditure was 1300-1600 kcal/d, and that on average protein accounted for 16-19% energy expenditure during the entire fasting period.
If, during total starvation, obese individuals were to derive about 20% of their energy from protein oxidation, as in the hypothetical lean subject depicted in Figure 3, they would die with most of their fat in situ. This would clearly not be the optimal metabolic strategy for prolonged survival.
The situation of an obese individual, twice his ideal body weight is depicted in the lower part of Figure 3. He weighs 140 kg, has excess fat and fat-free tissue in the ratio of about 3/1 (WEBSTER et al., 1984; GARROW, 1981), so that the total amount of body fat is 61.5 kg and total protein 15.7 kg. This individual has energy stores that are six-fold greater than in the lean individual. If these fat stores are largely utilized during starvation, survival will obviously be prolonged, but this would only occur if the utilisation of the more limited 'protein stores' is substantially reduced (see below for evidence).
In the example shown in Figure 3 the proportion of energy derived from protein (Pcal%) is only 6% compared to 21% in the lean individual. More than half the weight loss in the obese is fat, whereas most of the weight loss in the lean individual is fat-free mass.
Therefore,
this model makes two simple but important predictions: obese
individuals survive longer during starvation than lean
individuals; and protein oxidation contributes a smaller
proportion to total energy expenditure in the obese than in the
lean (i.e, smaller loss of lean tissue [smaller N loss] for each
kg loss of body weight).
There is ample evidence to
support the first postulate of the model; that obesity increases
survival time during starvation uncomplicated by disease. For
example, obesity in both mice and humans can prolong survival
time several-fold (Table 3). The remarkable obese subject
studied by STUART and FLEMING (1973) had an initial body weight
of 207 kg, but after successfully starving for 382 days (no
energy intake) he achieved a final weight of 81.6 kg and entered
the Guinness Book of Records as the subject undergoing the
longest 'total' fast. In 1966, THOMSON and his colleagues (Table
2) reported two other obese subjects who fasted 200-300 days,
and several other authors have reported fasts in obese subjects
which lasted between 100-200 days. In contrast, the reported
survival time in lean subjects is less than 80 days. Nine of the
10 Northern Ireland festers (members of the Independent
Republican Army), who died of starvation between May and August
1981, survived between 57-73 days (these results have been
compiled from various newspaper reports). The remaining subject
died after only 45 days of starvation but he had a prior gunshot
wound, emphasising the important interaction between injury and
starvation.
Various
famine studies have also repeatedly noted that women withstand
semi-starvation better than men (KEYS et al., 1950), and
this can again be explained by the larger initial percent body
fat in women.
It is more difficult to
obtain support for the second postulate of the model because of
the limited number of long-term studies reporting simultaneous
measurements of energy expenditure and N excretion. Many of the
comparisons in this paper are made between lean individuals with
a body mass index (BMI) close to 20, and obese individuals with a
BMI of ³ 35. However, in the past so much
emphasis has been placed on the classic study reported by
BENEDICT (1915) in which a lean 40-year-old male Maltese subject
(BMI 20.7) fasted for 31 days, that it is necessary to assess
whether the observations made on this subject are typical of
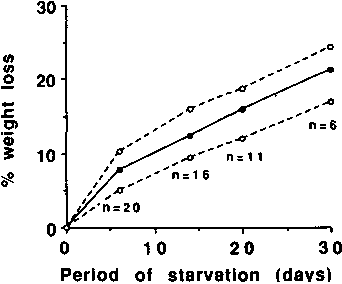
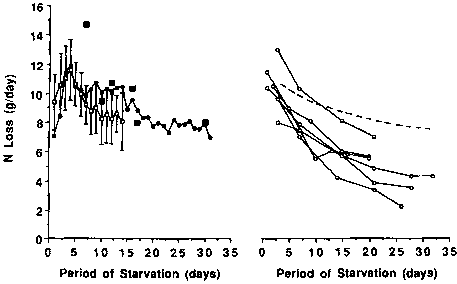
other lean individuals undergoing starvation. Figure 4 provides
evidence that the weight changes observed by BENEDICT (1915) on
his single subject are typical of other lean fasters, and Figure
5 provides evidence that the cumulative N loss is also
typical.
In constructing Figure 5, the results obtained in subjects whose urine N was measured using techniques that are considered to be inadequate, were excluded. For example, some remarkably low urine N excretions were reported in some of Succi's classic fasts, but this may be because only the urea N was measured in some of them. Since the proportion of urine N excreted as urea decreases substantially as starvation progresses, the results underestimate the extent of protein oxidation. Under normal circumstances, urea excretion accounts for about 85% of urine N excretion, but in prolonged starvation in lean individuals it may account for less than 70% (BENEDICT, 1915) and in obese individuals, less than 30% (CAHILL, 1970; AOKI, 1981).
The solid line represents the results obtained by BENEDICT in 1915, and the dotted line represents the 95% confidence interval (± SD) of other lean individuals. (Constructed using data provided by TAKAHIRA, 1925; LEHMANN et al., 1893; BENEDICT, 1915 [for summarized data of Succi's fasts and Jaque's fast]; CATHCART, 1907; BONNINGER and MOHR, 1906; and WATANABE and SASSA, 1914.)
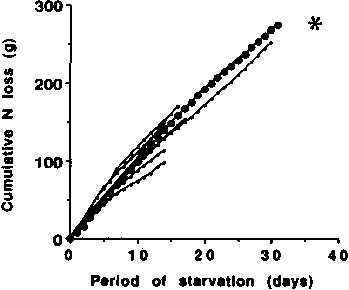
Mr. Levazin (BENEDICT, 1915) is indicated by the large solid circles. The other eight curves with smaller dots were constructed from the data of WATANABE and SASSA, 1914; BONNINGER and MOHR, 1906; VAN HOOGENHUYZE and VERPLOEGH, 1905; TAKAHIRA, 1925; and CATHCART, 1907. One set of data points is hidden behind the graph with the large solid circles. The asterisk represent the cumulative N loss of a subject studied by Driscoll and Filer (FORBES, 1979).
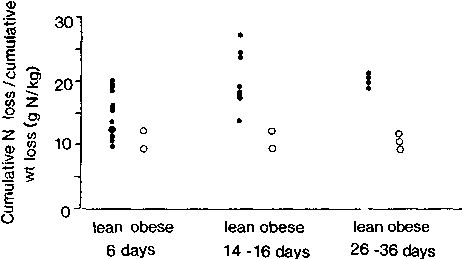
3.4.1. Loss of N per kg loss body weight
The contribution of protein oxidation to total (24-h) energy expenditure can be assessed semi-quantitatively using the ratio N loss to weight loss (g N/kg). If fat-free mass is lost in preference to fat, the ratio will be expected to be high, because fat-free mass contains about 32 N/kg, whereas fat has no N. In contrast, if fat was preferentially lost the ratio will be expected to be low.
The ratio (g N/kg weight loss) is not necessarily an accurate index of changes in body composition (or the proportion of total energy derived from protein oxidation) because the composition of the fat-free mass that is lost during starvation may be the same as that in the body. For example, during early starvation, loss of glycogen and water contributes substantially to the loss of fat-free tissue, and during prolonged starvation other body constituents, such as bone, brain and gonads, are preferentially preserved (Table 1). Nevertheless, the index, N loss/kg body weight loss, can give a semi-quantitative indication of protein-energy interrelationships during starvation.
Figure 6 suggests that the cumulative N loss/cumulative weight loss is lower in the obese than in the lean. After two weeks of starvation, distinct differences appear, and by four weeks there is a twofold difference in the ratio.
3.4.2. N excretion and the contribution of protein oxidation to BMR
Another simple way of assessing possible differences in protein metabolism between lean and obese individuals undergoing starvation is to compare their cumulative N excretion or their daily N excretion. Figure 7 illustrates the cumulative N excretion of obese individuals undergoing starvation. The dotted line, which is based on Figure 5, represents the values for lean individuals and approximates closely to the results of BENEDICT'S (1915) subject. Except for the first week of starvation the results of obese individuals fall below the dotted line.
Figure 8 shows that in subjects undergoing starvation the daily N excretion of obese individuals decreases to values that are lower than those observed in lean individuals. This means that, although obese individuals have more lean body mass and more body N than lean individuals, they 'hold on' to it more effectively than lean individuals. The model depicted in Figure 3 implies that this is a necessary prerequisite for prolonged survival in obese individuals undergoing starvation. It should be emphasized that the values for lean subjects (Figures 4-8) are mainly based on studies in men, who had an initial BMI of about 20, and sometimes less. The results of N excretion in individuals with an initial BMI of 25-30 may not be very different from those of obese individuals with an initial BMI of > 35.
All data points for the obese are for groups of subjects. Results for lean subjects calculated using data provided by GOSCHKE et al., 1975; LEHMANN et al., 1893; CATHCART, 1907; BONNINGER and MOHR, 1906; WATANABE and SASSA, 1914; and Driscoll and Filer as reported by FORBES in 1979. Results for obese subjects calculated using data (sometimes graphical data) provided by GOSCHKE et al., 1975; BALLENTYNE et al., 1973; BALL et al., 1967; and SWENDSEID et al., 1965.
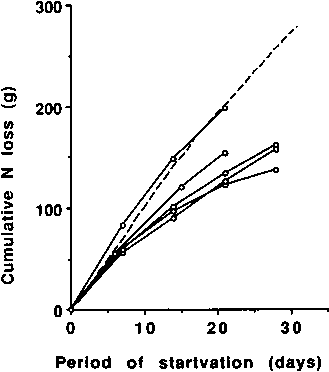
Those for groups of obese individuals were calculated from data (sometimes presented graphically) provided by the following authors - from top to bottom respectively, right hand part of graph: GOSCHKE et al., 1975 (male); HOFFER and FORSE, 1990; GOSCHKE et al., 1975 (female); CONTALDO et al., 1980; BALLENTYNE et al., 1973.
Left. The daily urine N excretion of the starving subject studied by BENEDICT (1915) (•--•) for 31 days. For comparison of results, those obtained from a group of 7 lean individuals fasting for 14 days are indicated as mean ± SD () and the results obtained on the last days of individual fasts lasting for 7 days or more indicated as solid squares (n). Based on BENEDICT, 1915; HOOVER and SOLLMAN, 1897 (penultimate day); TAKAHIRA, 1925; CATHCART, 1907; VAN HOOGENHUYZE and VERPLOEGH, 1905; BONNINGER and MOHR, 1906; WATANABE and SASSA, 1914; and LEHMANN et al., 1893.
Right. The daily excretion of obese individuals undergoing starvation (o-----o) compared to that of lean individuals (---). The data for lean individuals is based on the graph on the left. The data for groups of obese individuals are based on data by the following authors from top to bottom, respectively, right hand part of graph: GOSCHKE et al., 1975 (male); YOUNG et al., 1973; HOFFER and FORSE, 1990; L. AOKI, 1981; GOSCHKE et al., 1975 (female); and BALLENTYNE et al., 1973.
Figures 6 to 8 still do not indicate the percent energy derived from protein oxidation. However, since BMR is greater in obese than lean individuals, the discrepancy between lean and obese subjects is expected to be even greater. Unfortunately, there are relatively few studies in which both N excretion and energy expenditure have been measured in the same subjects. There are many more studies that have reported measurement of energy expenditure alone or N excretion alone. If the results of actual measured energy expenditure during starvation are compared with those predicted by the Schofield equations (SCHOFIELD, 1985) using the actual weight at the time of measurement, the results fall within + 20 to -30% of predicted values and usually between +10 to -30% after the first week of starvation (Figure 9) (the BMR of subjects, mainly female, on hypocaloric diets tends to remain between +20% of the predicted values). Therefore reasonable predictions of BMR can be made in starving subjects whose age and weight (± height) are known. If urine N is also known, then reasonable predictions can also be made of the precept contribution of protein oxidation to BMR (P%).
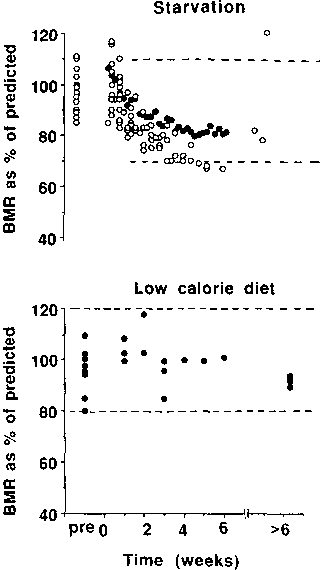
Upper graph: measured basal metabolic rate (BMR) expressed as percentage of predicted BMR using the Schofield equations (SCHOFIELD, 1985) in subjects undergoing total starvation (no intake of energy). The solid circles represent results of Benedict's study (BENEDICT, 1915) and the open circles the results of other studies (TAKAHIRA, 1925; CAHILL et al., 1966; OWEN et al., 1967; DRENICK and DENNIN, 1973; and M. ELLA, unpublished). The dotted lines correspond to 70 and 102% of the values predicted by the Schofield equations.
Lower graph: measured BMR as % predicted BMR using the Schofield equations (SCHOFIELD, 1985) in subjects on low-calorie diets (<1000 kcal/d and usually < 500 kcal/d) for 1-23 weeks. Calculated using results of BARROWS and SNOOK, 1987; MERRIL et al., 1980; RAVUSSIN et al., 1985; MATHIESON et al., 1986; ELLIOT et al., 1989; GARROW and WEBSTER, 1989; FRICKER et al., 1991; ROZEN et al., 1986; FINER et al., 1986; BESSARD et al., 1983; and HOFFER et al., 1984. Where only oxygen consumption was measured, energy expenditure during hypocaloric dieting was calculated using a respiratory quotient of 0.75. The points are group mean calculations. The dotted lines correspond to 80 and 120% of the values predicted by the Schofield equations.
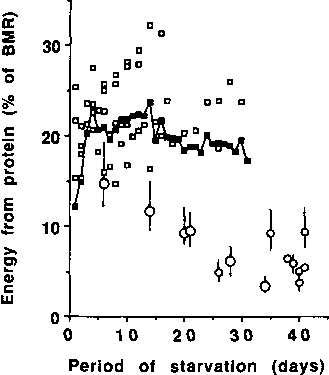
The solid squares (n) are based on the results of BENEDICT (1915) and the open squares () which surround the solid squares are based on measurements of BMR and N excretion in other lean individuals. The open circles (for obese individuals) without bars are also based on measurements of both BMR and N excretion. Those with bars (obese individuals) are based on measurement of urine N excretion and estimated BMR (70-110% of values predicted by Schofield equations - see text). The larger open circles represent group mean data, and the small open circles individual data. All data for obese individuals are for periods of starvation of 70 days or more, calculated using data of BENEDICT, 1915; TAKAHIRA, 1925; OWEN et al., 1967; 1969; GOSCHKE et al., 1975; YOUNG et al., 1973; and FELIG et al., 1971.
Figure 10 shows that the values for P% during starvation in lean subjects are up to three-fold higher than in obese subjects, especially during prolonged starvation. In lean individuals, protein oxidation usually contributes about 15-25 % to BMR with little tendency for the percentage to decrease as starvation progresses. In contrast, several of the values for obese individuals are less than 10% of BMR. A theoretical curvilinear relationship between percent energy (% BMR) derived from protein oxidation on the one hand and BMI or percent body fat on the other, is shown in Figure 11.
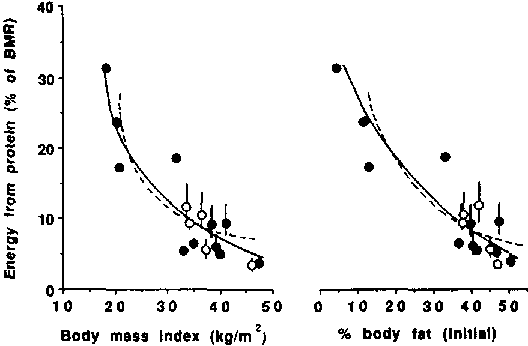
The dotted line represents the theoretical curves generated from the model presented in Figure 3 (for the entire starvation period for male subjects assuming that the ratio of total expenditure to BMR is 1.3 and that the composition of excess weight is three parts fat and one part fat-free mass). The closed circles (l) represent individual data (9M 4F) and the open circles (O) group mean data of four female groups and one mixed (male and female). The symbols without bars represent results based on measurement of both urine N excretion and BMR. The symbols with bars represent the range of results based on measurements of urine N excretion and estimated BMR (70-110% of values predicted by the Schofield equations - see text). Calculated using data of BENEDICT, 1915; TAKAHIRA, 1925; OWEN et al., 1967; 1969; GOSCHKE et al., 1975; YOUNG et al., 1973; and FELIG et al., 1971. The female subjects had an initial BMI of > 33 kg/m2 which is in the range where there is little difference in P% values between genders (the same BMI in women is associated with a higher % fat than in men).
Actual data obtained from the present analysis conform closely to the theoretical curve. The greater the degree of obesity, the lower the value for P%. The greatest changes in P% occur when the variations in body mass index (BMI) or percent body fat are at the lower end of the scale (Figure 11).
If the
energy derived from protein oxidation is expressed in relation to
total (24-h) energy expenditure, all the values in Figure 11 would
be lower. Some variability will be introduced on account of the
variable energy expenditure associated with physical activity.
However, this variability may be less than in normally nourished
subjects, since voluntary activities undertaken by starving
subjects have frequently been reported to be reduced (such a
reduction provides another way of prolonging survival). The
variability in energy expenditure due to physical activity is
unlikely to blur the large differences in P% between lean and
obese subjects (Figures 10 and 11). Therefore, the
second prediction of the starvation model (Figure 3) is
met.