2.1.2. Integration of protein-energy relationships and nitrogen balance
By combining data from the various human studies discussed above, together with a number of other studies where nitrogen balance data, energy and nitrogen intake data were available simultaneously, some 361 N-balance periods were available for our evaluation. Included with these were the 18 composite balance periods originating from the 460 balance studies collected by CALLOWAY and SPECTOR (1954).
Statistical analysis began with simple linear regressions separately relating N balance to N intake and N balance to energy intake. The abbreviations that will be used throughout will be NB = Nitrogen Balance (ma N/kg body weight); NI = Nitrogen Intake (ma N/kg body weight); EI = Energy Intake (kcal/kg body weight); Pcal% = protein calories percent (protein g/100 g, multiplied by 400, divided by kcal/100 g), and BWt (kg) will represent body weight as reported by the investigators for the appropriate N-balance period studied. The following results were obtained (where n = 361):
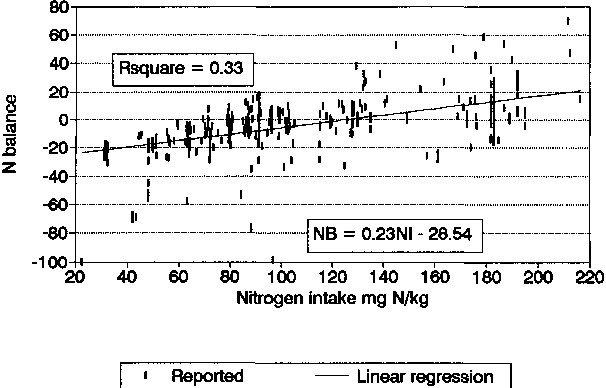
NB = 0.23 NI-28.54 |
R2 = 0.33 |
SE of slope = 0.02 |
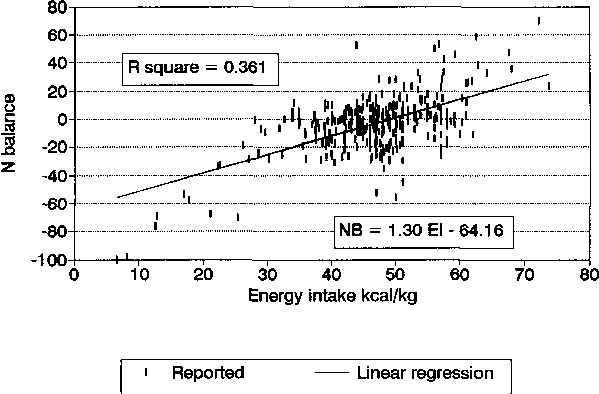
NB = 1.30 EI-64.16 |
R2 = 0.36 |
SE of slope = 0.09 |
The regression coefficients were highly significant and indicate that both NI and EI are similarly effective in influencing NB, and each individually can explain about one third of the variation in NB. The full data points relating NB with NI and EI, with the simple linear regression lines superimposed, are shown in Figures 5 and 6, respectively.
Multiple linear regression analysis was also performed and gave the following results:
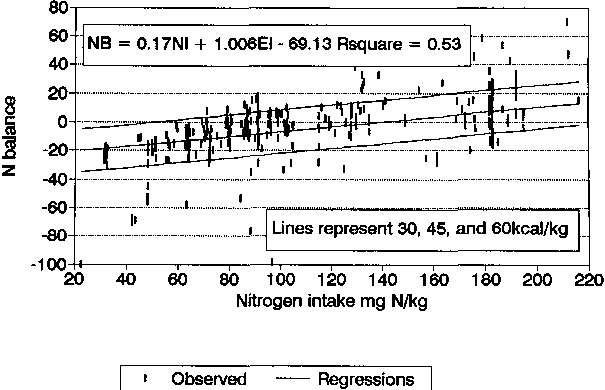
NB = 0.17 NI + 1.01 EI - 69.13 |
R2 = 0.53 |
NB = 0.36 NI + 0.46 EI - 3.47 |
Pcal + 0.22 BWt - 56.39 |
R2 = 0.58 |
These equations indicate that, for this data base, 53% of the variation in N balance can be explained by NI and EI in combination. The value increases to 58% when Pcal% and body weight are also included in the analysis. The relative importance of the various variables when operating independently is shown in the following Pearson correlation matrix (n = 361):
NB |
NI |
EI |
Pcal |
BWt |
|
NB |
1.000 |
||||
NI |
0.574 |
1.000 |
|||
EI |
0.600 |
0.314 |
1.000 |
||
Pcal |
0.084 |
0.727 |
-0.309 |
1.000 |
|
BWt |
-0.198 |
-0.116 |
-0.511 |
0.158 |
1.000 |
Significance levels for R:
p <0.05 = 0.138; p <0.01 = 0.181; p<0.001 = 0.230
It should be noted that the values tabulated here are for R rather than R2 and, thus the individual correlations between NB and NI and NB and EI remain exactly as shown earlier. The non-significant relationship between NB and Pcal% is noteworthy, confirming that Pcal% by itself is of little predictive value. Nevertheless, the combination of NI with Pcal% can marginally improve the predictive power over that involving NI and EI as the independent variables with the regression equation:
NB = 0.43 NI - 4.69 Pcal - 22.75 |
R2 = 0.57 |
The statistically significant relationships between NB and BWt (p < 0.01) and EI with BWt (p < 0.001) are also of interest, while those between Pcal% and NI and EI are fully explained by the definition of Pcal%. Slightly higher values for R2 can be obtained by including squared values for NI and/or EI, thus producing curvilinear relationships:
NB = 0.70NI + 1.10EI-0.002NI2-99.00 |
R2 = 0.59 |
NB = 0.65NI + 2.62EI-0.002NI2-0.018EI2-127.38 |
R2 = 0.61 |
The improvement is minimal and hardly warrants the more complex calculation. Nevertheless, the curves involving both square terms are shown in Figure 7.
An alternative approach for observing increased R2 values is by omitting studies which contained high variability. This additional variability could be associated with differences in protein quality, dietary carbohydrate and fat levels and those studies in which there was a small range for both NI and EI. Six studies (INOUE, 1973 [Egg data only]; CALLOWAY, 1975; GARZA et al., 1976; 1978; KISHI et al., 1978; CHIANG and HUANG, 1988) were selected where high-quality protein was given and where there was a reasonable range for NI and EI. Because the CALLOWAY and SPECTOR (1954) study was the only one where the range of intakes was very large, this was also included, even though information on the protein quality of the diet was not provided. The resulting regression equations (n = 140) for this selected data base were:
NB = 0.37 NI + 0.97 EI-2.97 Pcal +
0.44 BWt-94.88 |
R2 = 0.81 |
NB 0.23 NI + 1.46 EI-91.20 |
R2 = 0.70 |
NB = 0.54 NI- 5.26 Pcal-26.20 |
R2 = 0.74 |
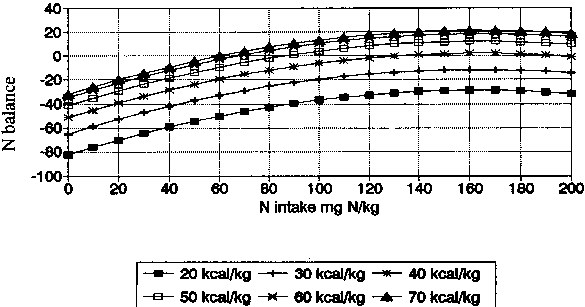
Derived from 361 N-balance periods. Multiple regression involving square terms using equation: NB = 0.65 NI + 2.62 El - 0.002 NI2 - 0.018EI2 -127.38; R2 = 0.61.
The Pearson correlation matrix for the data set (n= 140) was:
NB |
NI |
EI |
Pcal |
BWt |
|
NB |
1.000 |
||||
NI |
0.448 |
1.000 |
|||
EI |
0.713 |
0.007 |
1.000 |
||
Pcal |
-0.294 |
0.625 |
-0.627 |
1.000 |
|
BWt |
-0.030 |
0.260 |
-0.463 |
0.388 |
1.000 |
Significance levels for R:
p<0.05 = 0.166; p<0.01 = 0.217; p < 0.001 = 0.275
In the multiple regression equations, 81% of the variation in NB could be explained by NI, EI, Pcal and BWt, and 74% by NI and Pcal% alone while the simpler, direct use of NI and EI could explain 70% of the variation. From the correlation matrix, similar conclusions can be drawn as from the larger data set although in this case Pcal%, appears to be a statistically significant predictor by itself but with an R value that is much lower than those for EI and NI. The addition of squared terms for both EI and NI can apparently explain 84% of the variation in NB in this data group where the variation in other factors has been minimized:
NB = 0.55NI + 4.19 EI-0.002 NI2-0.037
EI2-149.59 |
R2 = 0.84 |
The next stage in the analysis of the large data set (n = 361) was an attempt to delineate the conclusions of MUNRO (1951; 1978) and CALLOWAY and SPECTOR (1954) for humans, and BLACK and GRIFFITHS (1954) and CAMPBELL (1988) for lambs and pigs, respectively, that there would be significant 'plateaus' observed in the relationships. It was expected that it could be demonstrated that, at certain levels of food energy intake, additional protein would be either much less or even non-effective and that, similarly, at certain levels of nitrogen intake, additional food energy would also be of little effect in improving N balance.
To examine this hypothesis, the procedure followed was that the N-balance data were first separated into six groups depending on their food energy intakes (< 35 to > 55 kcal/kg in 5 kcal/kg steps), and the groups were then further analyzed. This included determination of group averages, followed by linear regression relating NI and NB within each group. In a similar manner, the combined data (n= 361) were also separated in NI groups (<50, 50-90, 90-130, 130-185 and > 185 mg N/kg), and these groups were also analyzed.
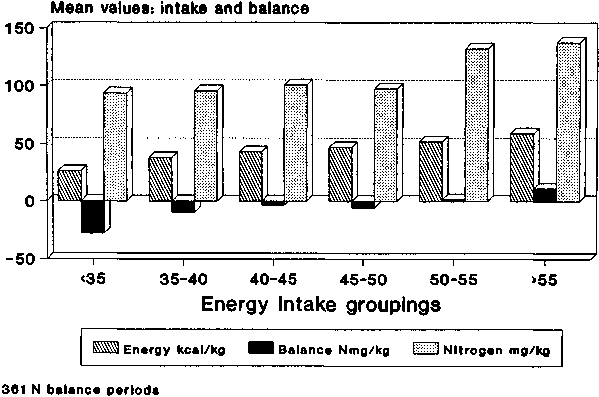
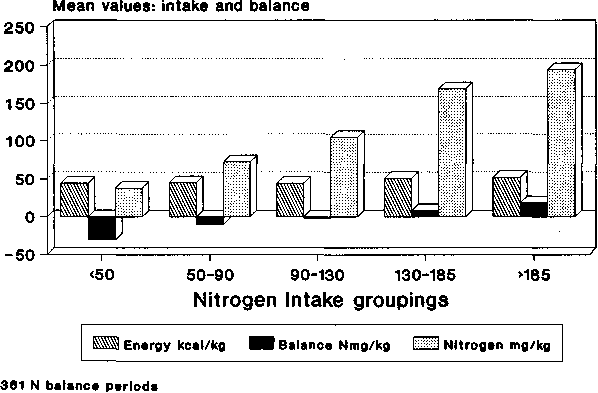
Nitrogen balance and NI data as grouped by EI are shown in Figure 8. For the energy intake groups, up to and including the 45-50 kcal/kg grouping, the average nitrogen intakes were similar, but for the two highest EI groups average N intake was also significantly higher. Nonetheless, it is clear that average NB improved as EI increased. When grouped by NI, as would be expected (Figure 9), NB improved with increases in NI. In this case, EI was almost constant for the first three groups and only increased slightly for the last two. These data, together with their standard errors of the means, are also shown in Table 3 where the significance of the changes in NB with both increasing NI and increasing EI is demonstrated. The significance of the changes of EI with NI and NI with EI can also be seen.
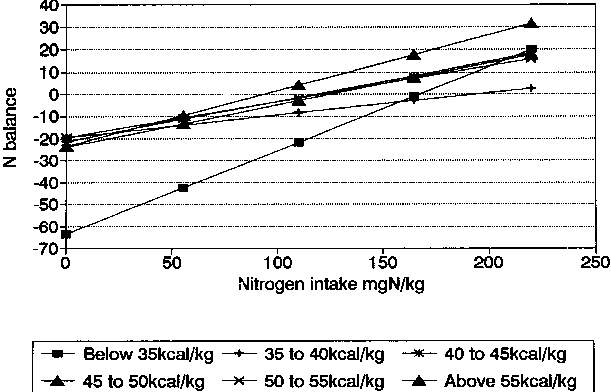
In Table 4, linear regression analyses are shown for both the EI and the NI groups. The slopes of the lines are also shown graphically in Figures 10 and 11. For the data classified by EI, all groups show that changes in NB continue to be influenced by NI, even for the lowest EI group whose mean level was 26 kcal/kg. This, while low, is nevertheless much higher than the values cited by CALLOWAY and SPECTOR (1954) where about 10 kcal/kg maximally reduced body protein destruction.
Table 3. N balance, energy intake and nitrogen intake in adults, for 361 periods classified by ranges of El and NI
Intake groups |
N |
Energy intake Mean ±
S.E. kcal/kg |
Nitrogen intake Mean
S.E. Mean ± S.E. mg N/kg |
Nitrogen balance mg
N/kg |
|||
A) Classified by Energy
Intake kcal/kg |
|||||||
<35 |
28 |
26.2 |
1.6 |
93.5 |
6.8 |
-27.9 |
6.3 |
35 to 40 |
34 |
38.1 |
0.2 |
95.5 |
5.9 |
-9.7 |
1.8 |
40 to 45 |
69 |
42.8 |
0.2 |
100.7 |
4.7 |
-3.5 |
1.4 |
45 to 50 |
112 |
47.3 |
0.1 |
97.5 |
4.5 |
-5.8 |
1.3 |
50 to 55 |
60 |
51.8 |
0.2 |
132.3 |
6.7 |
1.6 |
2.0 |
>55 |
58 |
59.0 |
0.5 |
137.8 |
6.8 |
11.1 |
2.8 |
B) Classified by Nitrogen
Intake mg N/kg |
|||||||
< 50 |
34 |
43.8 |
2.0 |
38.1 |
1.4 |
-30.7 |
3.4 |
50 to 90 |
107 |
45.3 |
0.8 |
72.4 |
1.0 |
-10.3 |
1.3 |
90 to 130 |
109 |
43.7 |
0.8 |
104.4 |
1.4 |
-2.1 |
1.4 |
130 to 185 |
92 |
51.1 |
0.8 |
169.0 |
2.0 |
8.3 |
1.7 |
>185 |
19 |
52.5 |
1.9 |
194.4 |
2.1 |
18.3 |
5.1 |
Table 4. Correlation coefficients and slopes from N balance studies: Prediction of Nitrogen Balance
Intake groups |
N |
R2 |
Regression from NI
Slope ± S.E. |
Constant |
|
A) classified by energy
intake kcal/kg |
|||||
< 35 |
28 |
0.174 |
0.38 |
± 0.16 |
-63.7 |
35 to 40 |
34 |
0.121 |
0.10a |
± 0.05 |
-19.6 |
40 to 45 |
69 |
0.341 |
0.18 |
± 0.03 |
-21.4 |
45 to 50 |
112 |
0.426 |
0.19 |
± 0.02 |
-24.0 |
50 to 55 |
60 |
0.272 |
0.16 |
± 0.03 |
-19.5 |
> 55 |
58 |
0.378 |
0.25 |
± 0.04 |
-23.6 |
B) classified by nitrogen
intake mgN/kg |
|||||
N |
R2 |
Regression from EI
Slope ± S.E. |
Constant |
||
< 50 |
34 |
0.646 |
1.40 |
± 0.18 |
-92.2 |
50 to 90 |
107 |
0.214 |
0.75bc |
± 0.14 |
44.1 |
90 to 130 |
109 |
0.421 |
1.13 |
± 0.13 |
-51.7 |
130 to 185 |
92 |
0.247 |
0.99d |
± 0.18 |
-42.5 |
>185 |
19 |
0.604 |
2.12e |
± 0.41 |
-92.7 |
a Significantly different from above 55kcal/kg group: P<0.05
b Significantly different from below 50mgN/kg group: P<0.05
c Significantly different from 90-130mgN/kg group: P<0.05
d Significantly different from above 185 mgN/kg group: P<0.05
e Significantly different from 50-90mgN/kg group: P<0.01
While few of the slopes relating NI with NB differ significantly, mainly due to the high SE in the under 35 kcal/kg group, all are significantly different from zero (see slopes and their SEs in Table 4) and confirm that increased NI leads to increased NB within all EI groups, even for the lowest energy intake range.
For the data classified by NI similar conclusions can be made. Even in the lowest group (mean = 38 mg N/kg) increased El increased NB. These low N intakes (ca. 17 g protein/d) are not dissimilar to those cited by CALLOWAY and SPECTOR (1954) for efficient utilization. The observations by CALLOWAY and SPECTOR (1954) were, however, accompanied by much lower (14 kcal/kg) values for EI than the mean value (44 kcal/kg) for the low NI group. The slopes of all lines relating NI and NB were steeper than those relating EI and NB and differed for the various NI groups (Table 4; Figures 10 and 11).
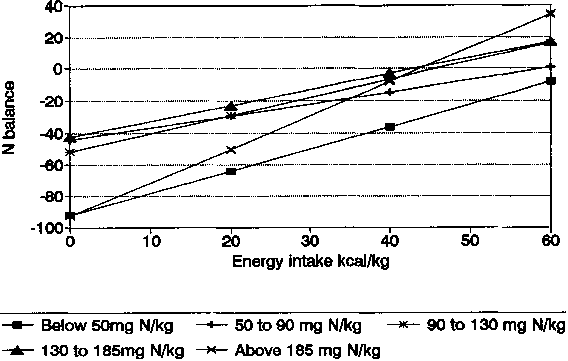
It is of interest that the steepest slope was for the highest NI grouping (mean = 194 mg N/kg) confirming the important influence of EI on NB even at the highest levels of NI. These high levels should be viewed in perspective, since they are equivalent approximately to only 85 g protein per day which is below average intakes, especially for young males, in most developed countries. For developing countries, the importance of high energy intakes in accompanying low to moderate levels of protein for maximum NB is made clear in these combined data and confirm the observations of TONTISIRIN et al. (1984a) of strongly positive N balances when ad libitum rice accompanied local protein sources.
In conclusion, over the range for NI and EI ca. 30 to 60 kcal/kg and 40 to 200 mg N/kg reported in a selection of experiments linking NB with EI and NI, it appears that increases in either EI or NI will improve NB, even at the lowest levels of EI (< 30 kcal/kg) or NI (< 50 mg N/kg). In other words, the statements of both CALLOWAY and SPECTOR (1954):
"At each fixed inadequate protein intake there is an individual limiting energy level beyond which increasing calories without protein or protein without calories is without benefit",
and MUNRO (1951; 1978):
"The improvement in nitrogen balance caused by an increase in energy intake, however, can be frustrated if intake of protein is inadequate; conversely, the beneficial effects of an increase in protein intake can be inhibited by an inadequate energy intake"
appear to be true only under much more extreme conditions of protein or energy limitation, than is the case for the majority of the studies included in our analysis. Within this range both EI and NI seem to be individually effective and no stepwise progression could be observed.
In Figure 12, the full data set relating NB with NI is shown with the multiple linear regression lines superimposed for 30 to 60 kcal/kg EI levels. The majority of the data points fit within these limits, and it appears that the regression equations can be used to predict NB with moderate accuracy. For the prediction of NB from NI and EI, the mean absolute difference between predicted and actual NB was 9 mg N with a SE of 0.5. For the prediction of NB from NI and Pcal% and also for the prediction involving square terms (Figure 7), the average differences between predicted and actual NB were almost identical to those observed with predictions from NI and EI indicating that all three regression equations had similar predictive ability.
