4.1. The theory
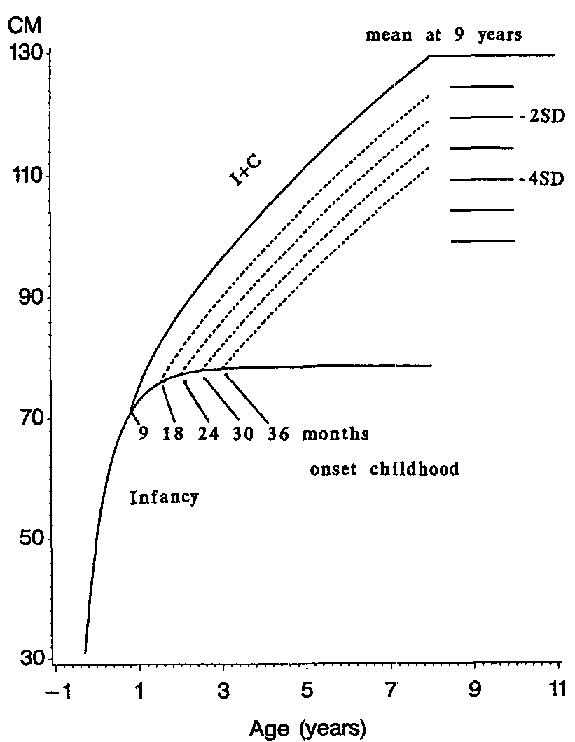
Fig. 4 depicts the two phases of growth during the first three years of life; the supposedly nutrition-dependent infancy phase and the GH dependent childhood phase, as well as the sum of the two. The age at onset of the childhood component occurs at 6 to 12 months of age in normal Swedish children, but is delayed in groups of infants with growth related disorders (Table 2).
Table 2. Mean and SD, in months, for the age at onset of the childhood component of supine length for different populations. The proportions of the infants being delayed (>12 months) in the age at onset are also given
Age at onset of the childhood phase |
||||||||
Boys |
Girls |
|||||||
n |
Mean mths |
SD mths |
% delayed |
n |
Mean mths |
SD mths |
% delayed |
|
Normal Swedish infants a |
111 |
8.86 |
1.96 |
0.0 |
80 |
8.13 |
1.92 |
0.0 |
Pakistani infants *b |
169 |
13.90 |
3.94 |
74.0 |
133 |
13.85 |
4.43 |
73.9 |
Celiac disease *c |
18 |
12.22 |
2.99 |
55.6 |
45 |
11.04 |
2.90 |
44.4 |
Turner syndrome *d |
47 |
11.54 |
3.20 |
36.2 |
||||
Cystic fibrosis **e |
26 |
9.71 |
2.04 |
11.5 |
19 |
8.45 |
1.76 |
5.3 |
Sotos syndrome ***f |
11 |
14.27 |
5.20 |
72.7 |
2 |
16.50 |
- |
50.0 |
Congenital dislocation of the hip ****g |
1 |
7.0 |
- |
0.0 |
13 |
8.69 |
1.41 |
0.0 |
* Disturbed growth and delayed childhood onset.
** Disturbed growth, but close to normal childhood onset.
*** Excessive infancy growth and delayed childhood onset.
**** Normal growth, but immobilised at 6 to 14 months of age.
a Karlberg et al., 1987a;
b Karlberg, Jalil & Lindblad, 1988;
c Karlberg et al., 1988
d Karlberg et al., 1991
e Karlberg Kjellmer & Kristiansson, 1991;
f Karlberg & Wit, 1991;
g Karlberg, Hägglund & Strömquist, 1991.

The significance of late onset of the childhood component in relation to attained height in subsequent years is depicted in Fig. 5 (Karlberg, 1989). The curves drawn are theoretical extrapolations, since the impact of late onset of the childhood component has been considered alone. The curves included represent the mean functions of the infancy and childhood components of the ICP growth model. The curves represent the path of length/height for different onset times of the childhood component. For instance, an onset at 24 months of age produces an attained height at 8 years of age of 2 SD below the mean.
A delay in the onset of the childhood phase results in a faltering pattern in length, which is similar to the faltering pattern in growth between 6 and 18 months seen in infants in developing countries. The following sections give some empirical support to this theory.
4.2 Observational studies of growth faltering - Lahore, Pakistan
4.2.1. Material and methods The Lahore data are from a follow-up study of the outcome of pregnancies registered in three areas, each with a population of 5000 (Jalil et al., 1993a; Hagekull et al., 1993). The areas represent different degrees of urbanisation in and near the city of Lahore: a typical village about 40 km from Lahore, a slum area at the periphery and a typical urban slum area in the city. The controls came from upper middle (UM) class families that lived in different locations in the city. Maternal illiteracy was common (93-95%) in the two poorer areas, i.e. the village and periurban slum, while it was only 51% in the urban slum. Eighty percent of the houses in the village and 95% in the periurban area were made of mud or straw, while the urban slum had 98% brick and 2% mud houses.
All pregnancies were registered over a period of 30 months, from September 1984 to March 1987. Of the 1476 children born alive, 159 died before reaching the age of 24 months, and 289 refused to participate in the study or moved from the area (Jalil et al., 1993a). Thus 1028 of the original cohort were in the study at the age of 24 months. In the present analysis all monthly observations were used. The growth of the upper middle class infants was used as reference for the other three groups for size, velocity and weight-for-length (Karlberg et al., 1993).
Information was collected on mortality, morbidity, body dimensions, teeth eruption, psychomotor development and feeding practices. The newborns were visited at home as soon as possible after birth, and subsequently every month during the first 24 months of life.
Some information is also included from a previous longitudinal study (1964-1978) of 910 infants living in a similar urban slum area in the center of Lahore (Karlberg, Jalil & Lindblad, 1988; Jalil et al., 1989).
4.2.2. Results and comments
Growth by area, sex and age. Fig. 6 gives the mean values of length for boys for each area in relation to the mean values in the NCHS reference (WHO Working Group, 1986; WHO, 1983). The mean length and weight of the UM class are close to the NCHS means, while the other three groups show various degrees of slower growth. Growth deficits are largest for the infants living in the periurban slum area, followed by those of the village. Weight and length for both sexes displayed similar patterns in relation to the NCHS reference as shown for length of the boys in Fig. 6.
The UM class-the reference group used in this work-was on the average 1.7 cm shorter than the NCHS reference mean at 24 months, so the proportion of infants characterised as being stunted in the other areas will be underreported from an international point of view. The incidence of reduced growth is shown in Fig. 7 by using the 3rd centile (approximately -2 SDS) of the NCHS reference at 24 months of age. In the two poorer areas about 75-83% of the infants were characterised as stunted at 24 months of age.
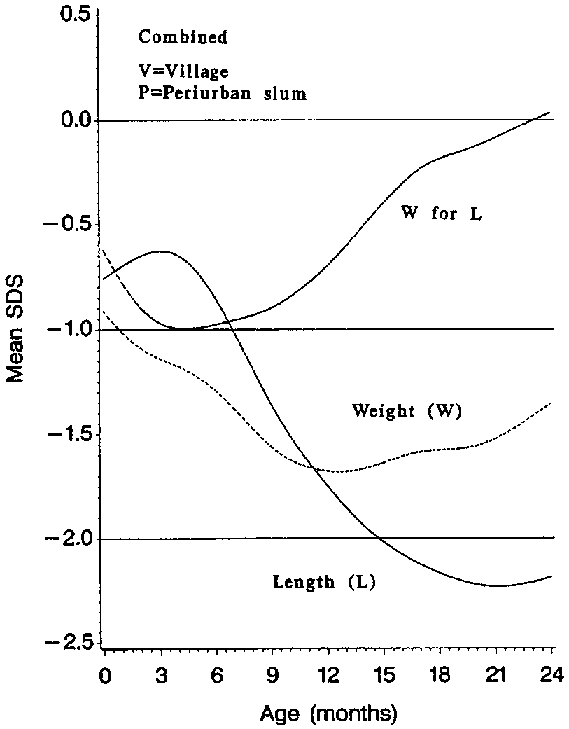
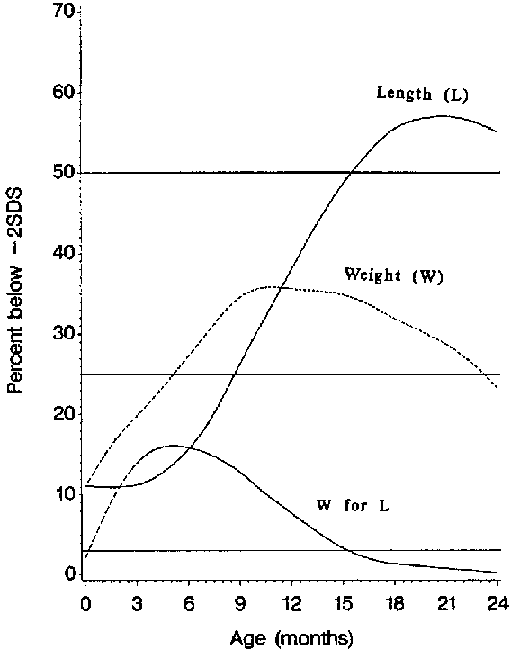
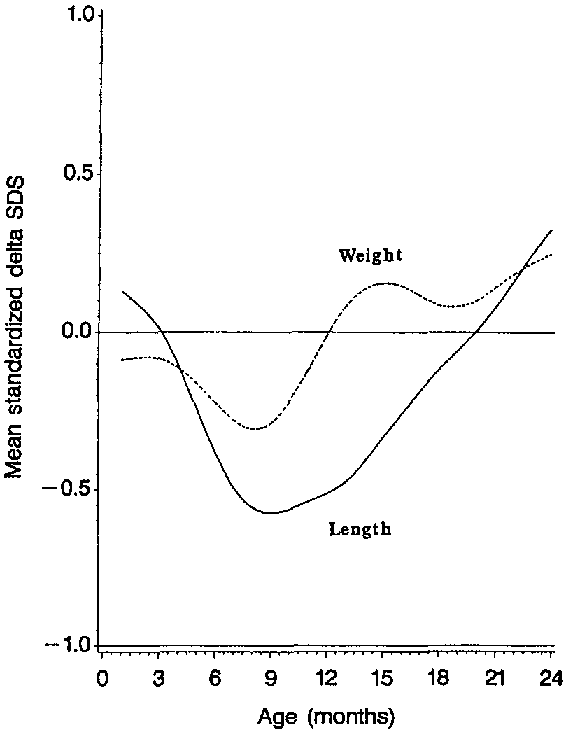
Growth in the two poorer areas by age. The boys and girls from the village and the periurban slum showed fairly similar mean growth values over the ages, and they were pooled in order to increase the sample size; their mean SDS values are given in Table 3. In Fig. 8 the smoothed mean SDS values are shown for weight, length and weight-for-length by age, and in Fig. 9 the proportion of the infants lying below -2 SDS for each measure. The stunting process starts at about 6 months of age and it continues to 18 months of age. At the same time the mean weight-for-length SDS increases from -1.0 and reaches the normal value of zero at 24 months of age. This faltering in length is similar to the findings in other similar areas around the world, although the proportion of the infants lying below -2 SDS in length in the two poorer areas at 24 months of age is one of the highest reported so far.
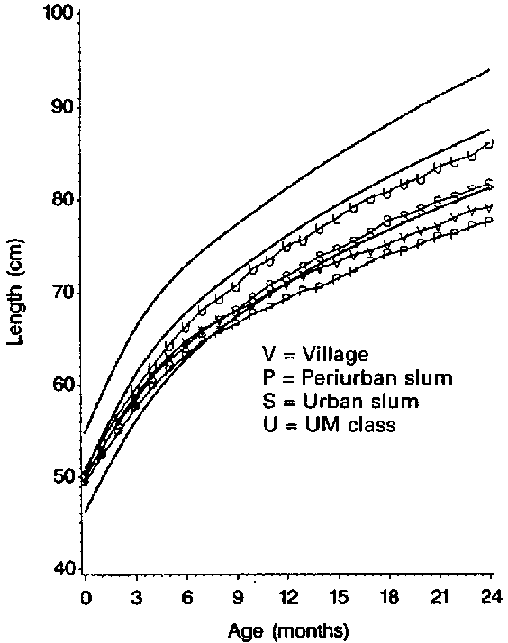
Table 3. Mean SDS values of different body measures (Lahore Study). Both sexes in the village and the periurban slum have been pooled. The proportions lying below -2 SDS are included for weight, length and weight for length (Karlberg et al., 1993)
Attainted size |
Delta SDS |
|||||||||
Weight (W) |
Length (L) |
W for L |
Weight |
Length |
||||||
Age (mths) |
n |
mean SDS |
%<-2 SDS |
mean SDS |
%<-2 SDS |
mean SDS |
%<-2 SDS |
n |
mean SDS |
mean SDS |
0 |
657 |
-0.84 |
9.3 |
0.79 |
11.4 |
-0.52 |
0.9 |
|||
1 |
592 |
-1.09 |
16.4 |
-0.70 |
10.8 |
-0.87 |
6.1 |
516 |
-0.47 |
0.10 |
2 |
532 |
-1.13 |
18.2 |
-0.67 |
12.0 |
-0.94 |
12.6 |
432 |
-0.12 |
0.03 |
3 |
548 |
-1.14 |
19.9 |
-0.62 |
10.4 |
-0.98 |
14.8 |
420 |
0.00 |
0.10 |
4 |
523 |
-1.15 |
20.3 |
0.58 |
10.9 |
-1.02 |
16.1 |
407 |
-0.14 |
-0.03 |
5 |
528 |
-1.20 |
25.4 |
-0.74 |
15.5 |
-0.95 |
15.7 |
408 |
-0.11 |
-0.30 |
6 |
488 |
-1.29 |
27.5 |
-0.85 |
15.2 |
-0.98 |
15.2 |
393 |
-0.22 |
-0.36 |
7 |
472 |
-1.33 |
27.5 |
0.97 |
16.3 |
-0.93 |
15.5 |
354 |
-0.28 |
-0.55 |
8 |
470 |
-1.48 |
33.6 |
-1.22 |
22.3 |
-0.91 |
13.2 |
348 |
-0.34 |
-0.60 |
9 |
454 |
-1.64 |
35.7 |
-1.41 |
27.3 |
-0.96 |
15.6 |
343 |
-0.35 |
-0.54 |
10 |
454 |
-1.60 |
35.9 |
-1.51 |
31.1 |
-0.82 |
8.8 |
326 |
-0.19 |
-0.58 |
11 |
472 |
-1.66 |
36.7 |
-1.62 |
32.6 |
-0.80 |
9.3 |
346 |
-0.17 |
-0.47 |
12 |
474 |
-1.67 |
33.5 |
-1.73 |
37.3 |
-0.70 |
7.8 |
366 |
-0.01 |
-0.50 |
13 |
456 |
-1.69 |
35.5 |
-1.85 |
43.0 |
-0.62 |
6.8 |
343 |
0.17 |
-0.54 |
14 |
450 |
-1.67 |
35.1 |
-1.95 |
44.7 |
-0.51 |
4.0 |
341 |
0.13 |
-0.42 |
15 |
460 |
-1.66 |
35.2 |
-2.05 |
49.6 |
-0.41 |
3.0 |
345 |
0.14 |
-0.33 |
16 |
489 |
-1.57 |
35.0 |
-2.05 |
49.5 |
-0.31 |
2.5 |
360 |
0.19 |
-0.20 |
17 |
467 |
-1.56 |
33.2 |
-2.13 |
54.2 |
-0.19 |
1.5 |
375 |
-0.14 |
-0.26 |
18 |
452 |
-1.56 |
30.5 |
-2.16 |
57.3 |
-0.18 |
0.9 |
347 |
0.01 |
-0.06 |
19 |
466 |
-1.59 |
31.5 |
-2.20 |
55.6 |
-0.18 |
1.7 |
351 |
0.14 |
-0.07 |
20 |
459 |
-1.58 |
29.4 |
-2.22 |
56.4 |
-0.16 |
1.3 |
359 |
0.01 |
-0.01 |
21 |
462 |
-1.54 |
29.2 |
-2.25 |
57.1 |
-0.09 |
0.2 |
352 |
0.21 |
0.06 |
22 |
429 |
-1.46 |
27.0 |
-2.23 |
57.3 |
-0.02 |
0.7 |
331 |
0.17 |
0.15 |
23 |
429 |
-1.41 |
26.8 |
-2.22 |
56.2 |
-0.00 |
0.7 |
317 |
0.25 |
0.31 |
24 |
429 |
-1.35 |
22.4 |
-2.17 |
54.5 |
0.03 |
0.0 |
322 |
0.23 |
0.30 |
The monthly growth rate SDS values (standardised delta SDS values) are depicted in Fig. 10, using the mean values for weight and length as they are given in Table 3. Initially, these mean values are close to zero for the two measurements, i.e., they follow the path of the UM class. Mean delta SDS values for length are negative from 5 months of age, reach a minimum at 8-11 months, and become normal at 18 months. Weight is less affected than length in early life and reaches normal or close to normal monthly growth rate values at 12 months of age.
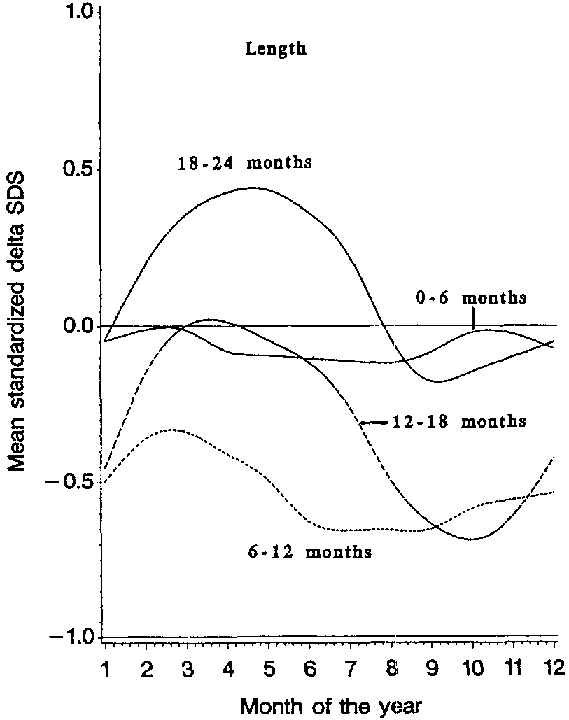
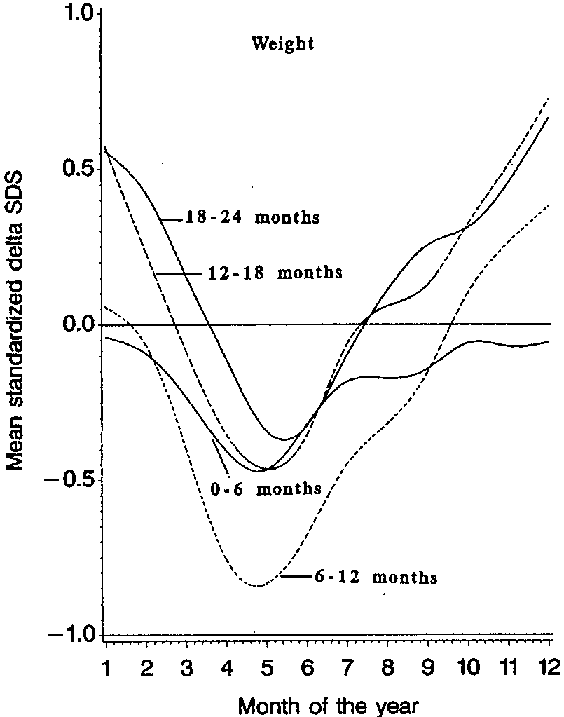
Growth in the two poorer areas by age and season. In Figs 11-12 the standardised delta SDS values (similar to velocity SDS values) of the monthly intervals are grouped according to age; the monthly intervals from birth to six months forming one group, and the monthly intervals from 6 to 12, 12 to 18 and 18 to 24 months constituting the other three groups (values not given in Tables). In Fig. 11 the mean length values are drawn for the four age groups over the months of the year. The monthly growth rates from birth to 6 months are close to the expected zero value with little seasonal variation. The growth rates from 6 to 12 months are also fairly constant over the seasons, but always reduced. During the second year of life, however, a marked seasonal variation in monthly growth rates is evident; the curves at 12-18 months and 18-24 months are similar in shape, but they are not at the same distance from the zero line of the reference group. Similar comparisons can be made for weight (Fig. 12), and the seasonal effect on weight gain, reaching its minimum during the summer, is evident in infants belonging to the four age groups.
Many previous studies have demonstrated a significant seasonal influence on child growth in poor areas of developing countries: a reduced weight gain during the summer months and a reduced length gain a few months later (Martorell & Habicht, 1986; Jalil et al., 1989; Hauspie & Pagezy, 1989).
We can draw three conclusions from these results: (i) that the incidence of impaired growth was highly area-dependent; (ii) that the body measurement being most affected was length; and (iii) that the incidence of undernutrition (weight-for-length) was relatively low, especially from the second half of the first year of life onward. These results are very much in line with the results of other studies suggesting that body size reflects the general socio-economic standard of a population. However, this study shows in detail the substantial variation in growth among children from different socio-economic strata within the same city. The UM class mothers were on the average 156.3 cm in height, which is 10-11 cm below the mean height of European adult women (Eveleth & Tanner, 1976), but only 2-3 cm above the Pakistani mothers from the other, poorer areas (Jalil et al., 1993b). We are thus observing the rapid phase of a secular trend in the UM class.
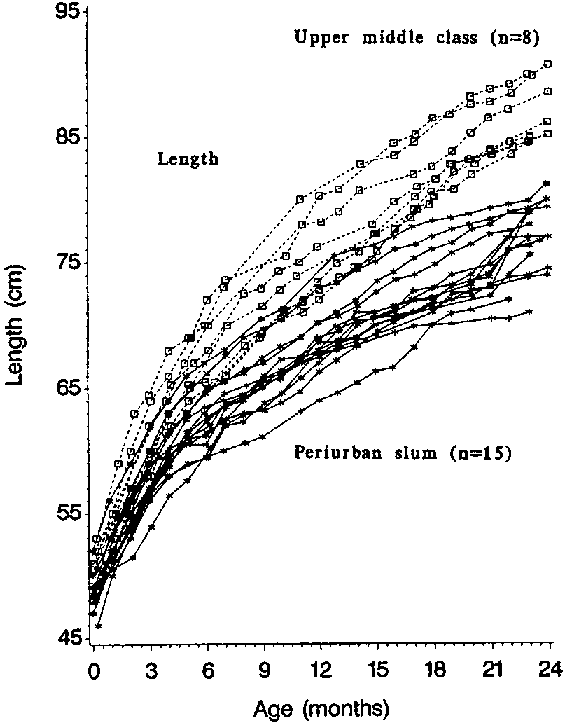
Onset of the childhood phase. Fig. 13 pictures the individual longitudinal pattern of length in 21 randomly selected infants; 8 belonged to the UM class and 13 to the periurban slum. The two sets of data are close to each other in early life, but during the second part of the first year of life most of the infants belonging to the poor area show growth faltering. We have not yet analysed these data in terms of the age at onset of the childhood phase of growth. However, this has been done in a previous longitudinal study of infants from an urban slum area in Lahore (Karlberg, Jalil & Lindblad, 1988; Jalil et al., 1989).
The observed gain in length of children in the previous study was similar to that observed in the children from the two poorer areas of the ongoing Lahore study. Between birth and 24 months of age these children grew on average about 7.5 cm less in length than the NCHS reference. The deficit in length during the first two years of life was found to be highly related to the age at onset of the childhood component, but also to some extent to the housing standard, the parental education level and the sex of the child (Karlberg, Jalil & Lindblad, 1988).
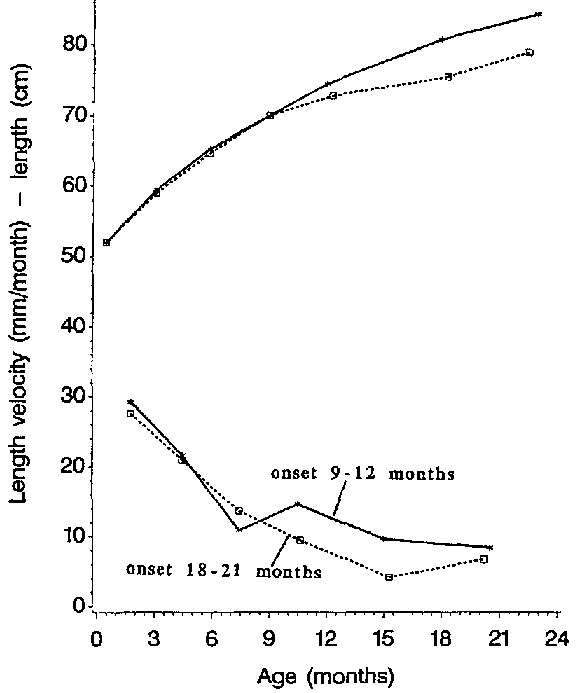
The onset of the childhood component was on average, delayed by 5.5 months in comparison with normal Swedish children (Table 2), and 75% of the infants had a delayed onset, occurring after 12 months of age. In 14% the onset occurred very late, at 21-24 months of age. The impact of a late onset on length development is illustrated in Fig. 14. The two curves represent the mean length and mean growth rate values for the two groups of boys either having an estimated age at onset of 9 to 12 months or 18 to 21 months of age. There is an important difference in the two velocity curves from 9 to 18 months of age. At 21 months of age the mean difference in length between the two groups was 5.5 cm, or about 2 standard deviations. The shape of the curve for the group of boys with a late onset is continuously falling off from birth to 18 months with an exponential shape without any discontinuity. This empirical observation is intriguing, since it supports the idea of an exponential infancy phase of growth acting from birth till at least 18 months of age.
Three conclusions can be drawn here: (i) that the onset of the childhood phase of growth may be delayed in the majority of infants living in poor areas of developing countries, as observed in the Lahore study; (ii) that the age at onset is probably the key discriminator between normally growing infants and infants showing growth faltering in early life; and (iii) that the faltering curve probably represents a normal or close to normal extension of the infancy phase of growth, but the problem is that the childhood phase has not been initiated normally.
4.3. Observational studies of faltering - Hong Kong
The Hong Kong study is also a prospective longitudinal study of 371 infants followed from birth to 24 months of age (Zheng et al., 1989; 1991; Tam et al., 1990; Zheng, 1991; Lam et al., 1992). All children were born between November 1983 and December 1984 in the United Christian Hospital and lived under crowded conditions in a suburb located on the Kowloon Peninsula (Kwun Tong). The parents were young, seldom educated beyond primary school and belonged to low or lower middle income families.
The main objectives of the study were to study the incidence of diarrhoeal diseases and the causative pathogens; the effect of neonatal rotavirus infection on subsequent rotavirus infection, and their impact on weight gain. The results have been published elsewhere (Lam et al., 1992). During a total of 7808 infant months, there were a total of 329 diarrhoeal episodes of which 48.8% had positive isolates. Rotavirus gastroenteritis accounted for 14.7% (44 episodes) and bacterial gastroenteritis for 33.7% (102 episodes). The incidence of diarrhoeal disease was 0.8 episodes per child per year, which was considered to be a low figure.
In Hong Kong the child health care system has been developed during the past 40 years, and the care provided to the study group was optimal or close to optimal. Full immunisation was also provided to all infants in Hong Kong already at the time of the study. The infant mortality rate has declined in Hong Kong over the years and is now less than or equal to most European countries; 192.3/1000 in 1947,25.6 in 1967, 7.5 in 1987 and 4.7/1000 in 1992 (Infant mortality rate and neonatal mortality rate of Hong Kong, 1992). The feeding pattern is different in Hong Kong than in other parts of the world. Most mothers go back to work 1-2 months after delivery, so that virtually all infants are given formula, not breast milk, beyond 1-2 months of age.
In the longitudinal study, infant development was monitored monthly by a clinician in one of the three community clinics in the suburb. Additional examinations were made at any sign of diarrhoeal disease. Weight was measured at each visit, length less frequently and in most infants at about 1, 7, 13 and 21 months of age (see Table 4).
Growth by sex and age. The data were initially treated cross-sectionally, i.e. month by month. Table 4 gives the mean values of weight and length by sex and age. Weight, but not length measurements were available for most infants from 1 to 24 months of age. Both weight and length were expressed in SDS using the NCHS growth reference values (WHO Working Group, 1986; WHO, 1983). The two sexes had similar mean SDS values for both weight and length over the ages and were consequently pooled. Fig. 15 gives the monthly mean weight SDS values. Also in this population we can note the faltering pattern, with normal weight values from 1 to 6 months of age, followed by a successive decrease in the values till 15 months of age. The vast majority of the infants were not breast-fed after 2 months of age, but the deficit in weight gain started only at 6 months of age.
Measures for both weight and length were selected for each child at 1,7,13 and 21 months of age. In cases where no examination had been made at these specific ages the nearest examination was selected (allowing for no more than 3 months' difference). Fig. 16 gives the proportion of the infants lying below -2 SDS from the mean of the NCHS reference for weight and length at 1, 7, 13 and 21 months. The percentage of infants thus being characterised as being short increased from a close to normal figure at 1 month to 12.3% at 21 months of age. The largest percentage increase occurred between 13 and 21 months. The shift in the whole distribution for length SDS is shown in Fig. 17; note that the percentage of the children that had a length above the reference mean decreased with age and reached a value of 25% at 21 months. The mean length SDS value decreased in a similar fashion over the ages and was -0.87 at 21 months of age. In spite of a low incidence of infectious disease in Hong Kong, the incidence of shortness at 21 months of age was quite high (12%).
An effort was made to determine the age at onset of the childhood phase in length in the Hong Kong infants. However, since length measurements were only taken infrequently in most of the infants, only the records of 19 infants could be used. In four of these cases (about 20%) we noted a delayed onset (after 12 months) of the childhood phase.
The Hong Kong infants show a much milder degree of growth faltering than the infants observed in the three poorer areas in Lahore. The faltering seems also here to be related to a delayed onset of the childhood phase of growth, and this in a population that was provided with good health care, a vaccination program and had a low incidence of disease.