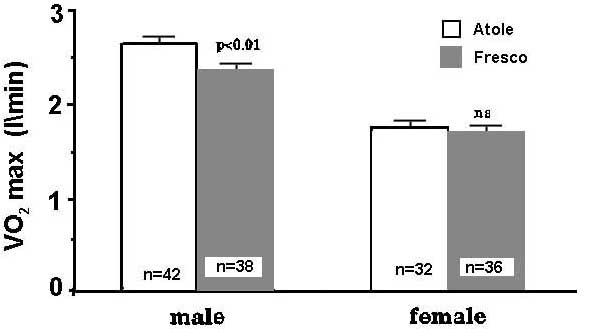
Oxygen consumption at maximum exertion (VO2max, L/min) is greater in males than females and increases with age (cohort) in both sexes, except that values are similar in females in Cohorts 2 and 3. VO2max was significantly h igher in Atole as compared with Fresco subjects when all cohorts are combined as shown in Table 3. This is seen in both sexes and regardless of whether body weight or FFM were controlled in the regression model. Atole vs. Fresco differences also are observed for VO2 max(L/min) in each cohort for males (Table 2), but the greatest treatment effect, based on both absohlte values and t values (effect size), is seen in Cohort: 2. Among females (Table 2), the Atole-Fresco differences in VO2max are similar across all cohorts (0.009-0.11 L/min), while only in Cohort l is this difference statistically significant at P<0.05.
TABLE 3 Mean1 VO² man for Atole and Fresco subjects: separate sexes, ages 11-26 y
Males |
Females |
||||||
Model no. |
Body size variable controlled¹ |
Atole (in = 92)² |
Fresco (n = 77) |
t value |
Atole (n = 75) |
Fresco (n = 84) |
t value |
L/min |
L/min |
||||||
I |
None |
2.43 + 0.04 |
2.15 + 0.04 |
4.99*** |
1.63 + 0.03 |
1.51 + 0.03 |
2.74** |
II |
Body weight |
2.41 + 0.03 |
2.18 + 0.03 |
5.47*** |
1.63 + 0.02 |
1.52 + 0.02 |
3.97*** |
III |
Fat-free mass |
2.39 + 0.03 |
2.21 + 0.03 |
4.60*** |
1.61 + 0.02 |
1.53 + 0.02 |
3.03** |
¹Adjusted for age, ages, socioeconomic status, village size and village size by supplement type interact-ion plus the body size measure indicated for each regression model. Values are means ± SE.
² Sample sizes reduced from Tables 1 and 2 due to missing data for socioeconomic status.
** P<0.01, *** P<0.001, two-tailed t test for difference between Atole and Fresco.
Although age may be the most important covariate in this analysis, other factors also may confound the relationship between treatment and V02max.
TABLE 4 Regression models to test the effect of nutritional supplementation on VO2 max mediated by various measures of boby size: Cohort ² males¹
|
Model 1 |
Model 2 |
Model 3 |
Model 4 |
Model 5 |
Model 6 |
||||||||
b |
P |
b |
P |
b |
P |
b |
P |
b |
P |
b( |
P |
|||
Intercept |
-1.33 |
0.039 |
-1.10 |
0.098 |
-0.52 |
0.25 |
-0.85 |
0.041 |
-4.81 |
<0.001 |
-0.83 |
0.39 |
||
Age,y |
0.217 |
<0.001 |
0.211 |
<0.001 |
0.038 |
0.24 |
0.048 |
0.096 |
0.:118 |
<0.001 |
0.039 |
0.22 |
||
Village size (1= large,0= small) |
-0.69 |
<0.001 |
-0.26 |
<0.001 |
-0.22 |
0.002 |
-0.30 |
<0.001 |
-0.26 |
<0.001 |
||||
Socioeconomic status |
0.029 |
0.67 |
-0.054 |
0.21 |
-0.053 |
0.18 |
-0.093 |
0.075 |
-0.058 |
0.20 |
||||
Volume of supplement ranking, percentile |
0.004 |
0.073 |
0.0004 |
0.78 |
0.001 |
0.31 |
0.001 |
0.46 |
0.0004 |
0.79 |
||||
Supplement type (1=Atole,0 =
Fresco) |
0.311 |
0.003 |
0.002 |
0.99 |
0.24 |
<0.001 |
0.18 |
0.003 |
0.23 |
0.005 |
0.24 |
<0.001 |
||
Supplement type by village size
interaction² |
-0.51 |
0.015 |
||||||||||||
Weight, kg |
0.053 |
<0.001 |
0.050 |
<0.001 |
||||||||||
Fat-free mass, kg |
0.067 |
<0.001 |
||||||||||||
Height, cm |
0.035 |
<0.001 |
0.003 |
0.71 |
||||||||||
R² (df) |
0.36 |
(2,83) |
0.51 |
(6, 72) |
0.77 |
(6, 72) |
0.80 |
16,72) |
0.68 |
(6, 72) |
0.77 |
(7, 71) |
||
RMSE |
0.46 |
0.43 |
0.28 |
0.26 |
0.33 |
0.28 |
||||||||
¹ VO2max was measured in L/min.
² Interaction was tested and if P was >0.20 the final model was run wither interaction
Therefore, the multiple regression analysis was expanded for Cohort 2 to include SES and level of subject participation in the nutritional supplementation program. The effect of supplement type before and after controlling for these covariates is given in Table 4 where the regression analysis is reported for Cohort males and in Table 5 for Cohort 2 females. Model 1 in these tables is the same analysis for which the t test results are reported in Table 2; that is, the difference in age-adjusted means for VO2max (L/min) between Atole and Fresco groups. Models 2-6 include age, village size, SES and volume of supplement as potential confounders. In all models for females and most models for males, volume of supplement and SES are not significant confounders. However, they are retained in all models for consistency of comparison of coefficients between models and between sexes. Models 3-6 test for the potential mediating effect of body size on the relationship between nutritional supplementation and VO2max. Model 3 gives essentially the same results, in terms of the magnitude and level of significance of the nutritional effect, as when VO2 is expressed per kg body weight or as maximum aerobic power (mL/kg. min -1) as shown in Table 2.
TABLE 5 Regression models to test the effect of nutritional supplementation on VO2 max mediated by various measures of boby size: Cohort 2 fameles¹
|
Model 1 |
Model 2 |
Model 3 |
Model 4 |
Model 5 |
Model 6 |
||||||
b |
P |
b |
P |
b |
P |
b |
P |
b |
P |
b |
P |
|
Intercept |
2.17 |
<0.001 |
2.02 |
<0.001 |
0.83 |
0.036 |
0.27 |
0.50 |
- 1.51 |
0.134 |
- 0.50 |
0.50 |
Age, y |
-0.031 |
0.22 |
-0.025 |
0.37 |
-0.044 |
0.023 |
-0.034 |
0.061 |
-0.027 |
0.29 |
-0.043 |
0.023 |
Village size (1 = large,0 = small) |
- |
- |
0.02 |
0.76 |
- 0.09 |
0.24 |
-0.09 |
0.18 |
- 0.013 |
0.84 |
-0.09 |
0.20 |
Socioeconomic status |
- |
- |
0.016 |
0.73 |
- 0.011 |
0.75 |
- 0.003 |
0.94 |
-0.022 |
0.62 |
- 0.024 |
0.50 |
Volume of supplement ranking, percentile |
- |
- |
- 0.0002 |
0.92 |
- 0.0003 |
0.78 |
- 0.0003 |
0.81 |
0.0001 |
0.93 |
- 0.0003 |
0.79 |
Supplement type (1 = Atole,0 =
Fresco) |
0.07 |
0.32 |
0.07 |
0.39 |
-0.02 |
0.83 |
- 0.07 |
0.34 |
- 0.012 |
0.87 |
- 0.045 |
0.58 |
Supplement type by village size
interaction² |
- |
- |
- |
- |
0.16 |
0.15 |
0.19 |
0.060 |
- |
- |
0.14 |
0.17 |
Weight, kg |
- |
- |
- |
- |
0.035 |
<0.001 |
- |
- |
- |
- |
0.032 |
<0.001 |
Fat-free mass, kg |
- |
- |
- |
- |
- |
- |
0.057 |
<0.001 |
||||
Height, cm |
- |
- |
- |
- |
- |
- |
- |
- |
0.025 |
<0.001 |
0.010 |
0.042 |
R2 (df) |
0.05 |
(2, 71) |
0.04 |
(5.61) |
0.59 |
(7.59) |
0.63 |
17, 59) |
0.25 |
(6,60) |
0.61 |
(8, 58) |
RMSE |
0.29 |
0.29 |
0.20 |
0.19 |
0.26 |
0.19 |
||||||
¹ VO2max measured in L/min.
² Interaction was tested and if P was >0.02, the final model was run withoutinteraction
For males (Table 4) an interaction (P = 0.015) is observed between supplement type and village size but only in Model 2. VO2max differences in males are seen exclusively in the large villages where Atole subjects have a 0.509 L/min higher value than Fresco subjects. For the models that include measures of body weight and height (3,5 and 6), age becomes nonsignificant as expected. However, village size remains a significant contributor to variation in VO2max with higher values seen in the large villages. Of importance in these models is that the size of the supplement type effect is fairly constant, the difference between Atole and Fresco ranging from 0.18 to 0.27 L/min.
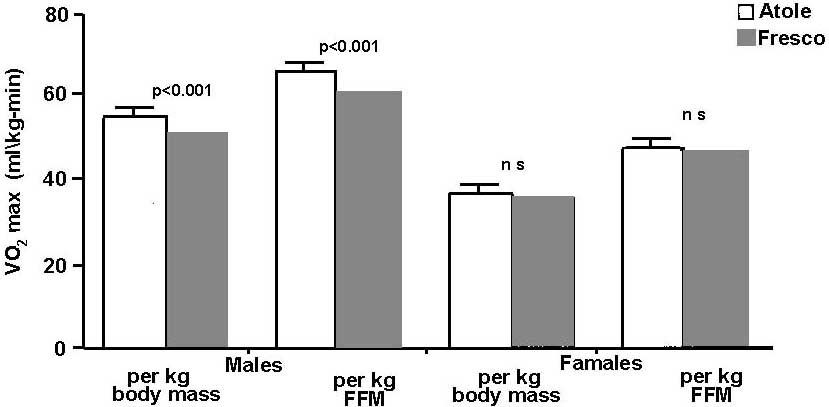
For females (Table 5) the addition of the four potential confounders in Model 2 does not change the size or significance of the supplement type effect seen in Model 1 and there continue to be no significant differences in VO2max associated with supplement type. The interaction between village size and supplement type seen in males (Table 4, Model 2) is not seen in females. When different measures of body mass are included in subsequent models (3,4 and 6) the supplement type effects approach statistical significance, but only in the context of differences in village size. There is a tendency for girls from Atole villages to have greater VO2max per unit of weight than girls from Fresco villages but only in the large villages (Model 3; the P value for the interaction is 0. 15). When FFM is controlled (Model 4) the interaction is much stronger, with a P = 0.06, reflecting a 0.19 L/min higher VO2max in the large Atole compared with the large Fresco village. When height is controlled (Model 5) neither the supplement type effect (P>0.05) nor its interaction (P>0.20) with village size are statistically significant. The results of these analyses for main effects of supplement type are presented graphically in Figures 2 and 3. The adjusted mean VO2max values can be seen to differ significantly between Atole and Fresco males regardless of which covariates are used in the adjustment or whether VO2max is expressed as L/min (Fig. 2) or divided by a measure of body size to reflect a measure of aerobic power (Fig. 3). However, the Atole and Fresco VO2max means are similar in females.
To assess the plausibility of these treatment effects, measures of physical work capacity were related to the amount of supplement consumed by individual subjects in Cohort 2 of Atole villages. The analysis, shown in Table 6, was conducted using linear regression procedures that modeled VO2max as the dependent variable with age and village size controlled as covariates and kilocalories of supplemental energy consumed during the first 3 y (kcal/d) as the independent variable. SES also was tested as a covariate but was not statistically significant in any model. Also, the interaction between village size and kcal/d was tested to determine if the slope of the relationship between VO2max and kcal/d was different between the large and small Atole villages. No interaction was detected (P>0.20) and the term was excluded from the final models. The statistically significant (P = 0.044) coefficient of 0.155 in Model 1 for males indicates that for every 100 kcal/d of Atole consumed over the first 3 y of life, there is a 0.155 L/min increase in VO2max measured at adolescence. When body weight is included in the Model 2, much of the dose effect is reduced and the coefficient drops to a 0.065 L/min increase in VO2 for a 100 kcal/d increase in supplement consumption (P = 0.193). For females, the dose response is opposite to that seen among males. For every 100 kcal/d increase in Atole consumption, there is a significant (P = 0.008) 0.169 L/min decrease in VO2max. When body weight is included in this model, the negative effect of supplement is reduced but remains statistically significant (P = 0.003).
TABLE 6 Relationship of VO2 max and amount of supplemental energy consumed in the first 3 y of life in Atole Cohort 2 adolescents, controlling for ace, village size and boar weight¹
|
Males |
Females |
||||||
Model 1 |
Model 2 |
Model 1 |
Model 2 |
|||||
b |
P |
b |
P |
b |
P |
b |
P |
|
Intercept |
-1.25 |
0.18 |
-0.79 |
0.19 |
2.63 |
<0.001 |
1.46 |
<0.001 |
Age, y |
0.23 |
<0.001 |
0.05 |
0.28 |
-0.05 |
0.14 |
-0.07 |
0.002 |
Village size (0 = small, 1 =
large) |
-0.23 |
0.13 |
-0.27 |
0.009 |
0.18 |
0.060 |
0.14 |
0.022 |
Kcal.100 per d |
0.155 |
0.044 |
0.065 |
0.19 |
-0.169 |
0.008 |
- 0.122 |
0.003 |
Weight, kg |
0.056 |
<0.001 |
0.030 |
<0.001 |
||||
R² |
0.34 |
0.74 |
0.28 |
0.73 |
||||
RMSE |
0.46 |
0.29 |
0.24 |
0.15 |
||||
df |
3, 39 |
4.38 |
3.28 |
4,27 |
||||
¹ VO2max measured in L/min.