Table 1 presents
descriptive statistics on children who were included in the
regression analyses for a particular age interval, and therefore
had information on supplement intake, anthropometric measures at
the beginning and end of the interval, a measure at the preceding
measuring period, sex, SES, percent of days with diarrhea and,
for all but the first and last intervals, energy from home diet.
Mean supplement intakes were ~ 100- 170 kcal/d (418-711 kJ) for
children consuming Atole. Children in Fresco villages consumed
<40 kcal/d (167 kJ) in the first 3 y of life increasing to ~80
kcal/d (335 kJ) at age 7 y.
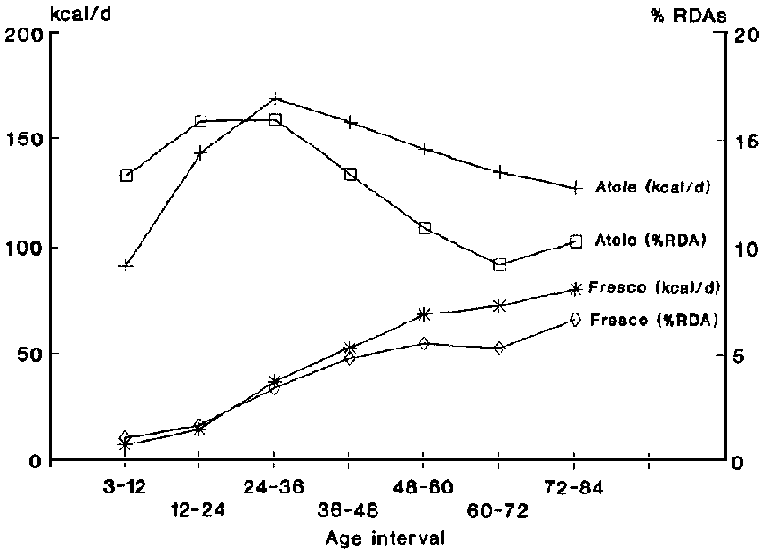
Differences in energy intake from supplement between the two groups were highly statistically significant at all intervals (P <0.001). Atole intakes represented ~10-16% of the RDAs and Fresco intakes about 1-7% of RDAs if the child's actual weight is used to calculate RDAs (Figure 1) and about half this amount if expected weights were used (not shown).
Mean length gains were significantly greater in the Atole villages compared with the Fresco villages for the first three intervals whereas weight gains were greater in the Atole villages only for the first two in.tervals (Table 1). Growth velocities compared with reference data (Baumgartner et al. 1986), however, were depressed greatly until ~3 y of age for both groups but were very similar to the reference data after age 3 (Figure 2). Patterns were similar for both males and females.
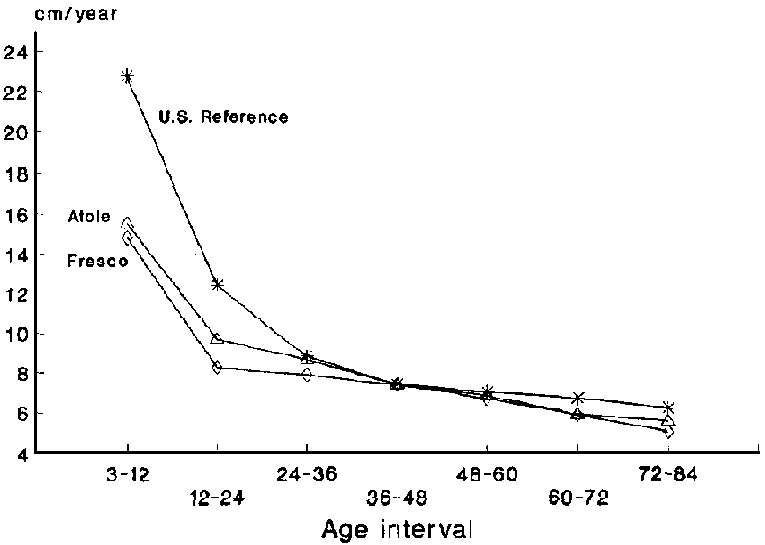
TABLE 1 Energy contribution of the supplements and mean annual growth rates in length and weight in Atole and Fresco villages¹
Supplement intake
(kcal/d)² |
||||||||||
Atole³ |
Fresco³ |
Weight (kg/y) |
Length (cm/y) |
|||||||
Age |
Atole |
Fresco |
Pooled |
Atole |
Fresco |
Pooled |
||||
(mo) |
n |
x ± SD |
n |
x ± SD |
X |
X |
SD |
X |
X |
SD |
3-12 |
274 |
90 ± 92 (54) |
251 |
7 ± 9c (3) |
3.41 |
3.19 |
1.01a |
15.6 |
14.7 |
2.7c |
12-24 |
180 |
143 ± 99 (123) |
151 |
14 ± 13c(10) |
2.17 |
1.74 |
0.78c |
9.2 |
8.2 |
2.0c |
24-36 |
221 |
169 ± 114 (145) |
198 |
37 + 30c (27) |
2.22 |
2.09 |
0.69 |
8.5 |
8.1 |
1.7b |
36-48 |
249 |
158 ± 123 (123) |
244 |
53 ± 37c (43) |
1.77 |
1.71 |
0.65 |
7.4 |
7.3 |
1.6 |
48-60 |
274 |
145 ± 112 (121) |
243 |
69 ± 44c (61) |
1.57 |
1.48 |
0.70 |
6.5 |
6.5 |
1.5 |
60-72 |
237 |
135 ± 108 (107) |
204 |
73 ± 44c(68) |
1.56 |
1.53 |
0.65 |
5.7 |
5.7 |
1.3 |
72-84 |
213 |
128 ± 115 (92) |
206 |
81 ± 49c (77) |
1.80 |
1.71 |
0.73 |
5.4 |
5.2 |
1.4 |
¹ t-test between Atole and Fresco: a = P<0.05; b = P<0.01; c = P<0.001.
² To obtain kilojoules, multiply kilocalories by 4.184.
³ Values in parentheses are medians
A sample of the multiple regression models is presented in Table 2. In this case, supine length change (millimeters/year) was regressed on energy from supplement (100 kcal/d or 418 kJ) and on covariates for each age interval. Although all covariates were not statistically significant in each of the full models, all covariates were retained in all models (except home diet in the first and last age interval) for ease of comparison. Excluding nonsignificant covariates had little impact on the magnitude and the significance of the parameter estimates of interest. Interactions between supplement and each of the covariates were tested in this series of models as well as those presented below. However, because no interaction was significant for more than one age interval, none were included in the final models.
In the series of models presented in Table 2, an extra 100 kcal/d (418 kJ) of supplement was associated with ~9, 5 and 4 mm in additional annual length gain during the first, second and third year of life, respectively. After age 3, there was no impact of supplement on length gain. Covariates included in the models displayed the expected associations with length gain. The negative association between length at the beginning of the interval and growth during the interval reflects the "regression to the me an" phenomenon documented elsewhere. Differences in growth rates by gender is inconsistent with significant estimates in favor of the males seen only at the 12- to 24- and 48- to 60- age periods. Higher socioeconomic status was associated with greater length gains in the 3- to 12- and 12- to 24-mo age periods, with gains of approximately an extra 3 mm for each standard deviation unit of the factor score. Diarrhea had a consistent negative impact on growth. For the models in Table 2, each additional 10% of days with diarrhea resulted in between 2.1 and 7.3 mm less length gain. Finally, more energy from the home diet was associated with greater length gains in the 24- to 36-mo period. In spite of its questionable validity in the dataset (Habicht et al. 1995), home diet was retained in the models presented in this paper for theoretical reasons and because excluding it had little impact on the parameter estimates of interest.
TABLE 2 Multiple variable regression models of supine length change (mm) per year on supplement calories (100 kcal/d or 418 kj and covariates
Age category (mo) |
|||||||
Variable |
3-12 |
12-24 |
24-36 |
36-48 |
48-60 |
60-72 |
72-84 |
(n = 525) |
(n = 331) |
(n = 419) |
(n = 493) |
(n = 517) |
(n = 441) |
(n = 419) |
|
Intercept |
217 ± (25)¹'c |
22 ± (28) |
124 ± (19)c |
92 ± (16) |
69 ± (15) |
67 ± (15) |
87 ± (20) |
Supplement (100 kcal/d) |
9.2 (1.5)c |
4.7 (1.1)c |
3.7 (0.8)c |
0.8 (0.7) |
0.8 (0.7) |
1.4 (0.7) |
-0.2 (0.8) |
Length at T-1 (cm) |
-1.4 (0.5)b |
0.8 (0.4)a |
-0.7 (0.3) |
-0.3 (0.2) |
-0.1 (0.2) |
-0.1 (0.2) |
-0.2 (0.2) |
Male gender |
-0.3 (2.3) |
6.2 (2.2)b |
-0.3 (1.7) |
1.1 (1.5) |
3.9 (1.4)b |
2.2 (1.3) |
0.04 (1.6) |
SES (sd units) |
3.2 (1.3)a |
3.7 (1.2)b |
0.7 (0.9) |
0.3 (0.7) |
-1.3 (0.7) |
1.0 (0.7) |
-0.3 (0.8) |
Diarrhea (10% d) |
-2.1 (0.9)a |
-2.5 (1.0)a |
-2.5 (1.2)a |
-3.5 (1.7)a |
-4.3 (1.9)a |
-2.8 (1.8) |
-7.3 (2.8)a |
Home diet (100 kcal/d) |
0.2 (0.4) |
0.8 (0,3)b |
0.4 (0.2) |
0.1 (0.2) |
-0.2 (0.2) |
||
R-square |
0.10 |
0.13 |
0.07 |
0.02 |
0.04 |
0.03 |
0.02 |
Separate models by age category. Atole and Fresco children combined.
¹ Parameter estimate (means + SE. a P<0.05; b P<0.01; c P<0.001.
Table 3 presents the slopes of the regression of supine length and weight change on supplement, stratified by supplement type. Similar to the pooled results, Atole had the most significant impact on length in children <36 mo and on weight in children <24 mo. The impact of Fresco is highly erratic with large standard errors; the only significant impact is that on length at 60-72 mo. Possible explanations for these patterns of effects are discussed in depth elsewhere (Habicht et al. 1995).
TABLE 3 Slopes and standard errors of regression of supine length (mm) and weight (g) change per year¹ on supplement calories (100 keel/d or 418 kJ)
Supine length |
Weight |
|||||||||||
Atole |
Fresco |
Total |
Atole |
Fresco |
Total |
|||||||
Age (mo) |
b² |
SE |
b |
SE |
b |
SE |
b |
SE |
b |
SE |
b |
SE |
3-12 |
9.1 |
1.6a |
-22.2 |
18.9 |
9.2 |
1.5c |
337 |
58c |
528 |
680 |
338 |
52c |
12-24 |
2.0 |
1.4 |
3.8 |
13.5 |
4.7 |
1.1c |
126 |
54a |
404 |
489 |
243 |
42c |
24-36 |
3.2 |
1.0b |
4.9 |
4.0 |
3.7 |
0.8c |
21 |
42 |
272 |
170 |
6034 |
|
36-48 |
0.3 |
0.6 |
1.8 |
3.5 |
0.8 |
0.7 |
7 |
32 |
-152 |
123 |
10 |
29 |
48-60 |
0.1 |
0.7 |
4.8 |
2.5 |
0.8 |
0.7 |
17 |
38 |
12 |
100 |
23 |
33 |
60-72 |
0.6 |
0.7 |
5.8 |
2.5a |
1.4 |
0.7 |
28 |
37 |
132 |
107 |
28 |
34 |
72-84 |
-0.6 |
0.8 |
-0.5 |
2.2 |
-0.2 |
0.8 |
10 |
45 |
194 |
100 |
43 |
39 |
¹ t-test between Atole and Fresco: a p <0.05; b p<0.01; c p<0.001.
² After controlling for initial body size, diarrhea! disease, socioeconomic status, gender and, for all but the first and last intervals, energy from home diet.
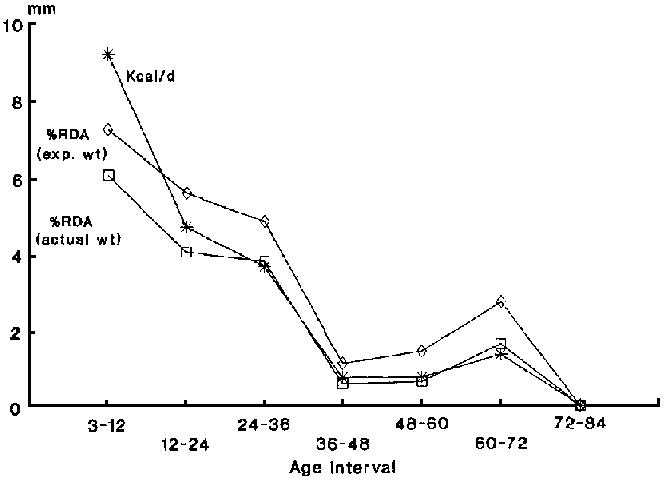
The slopes of supplement calories (100 kcal/d or 418 kJ) are compared with those obtained by calculating supplement intakes as 10% of the RDAs (calculated using both actual and expected weights) in Figure 3. Though there is some variation depending on how supplement intakes are expressed, the pattern is clear; impact of supplement on length gain is only seen in the first 3 y of life. A similar pattern is seen with weight gain (Figure 4). An extra 100 kcals/d of supplement was associated with an extra 350 and 250 g in annual weight gain during the first and second year of life, respectively, with no significant benefit seen at older ages.

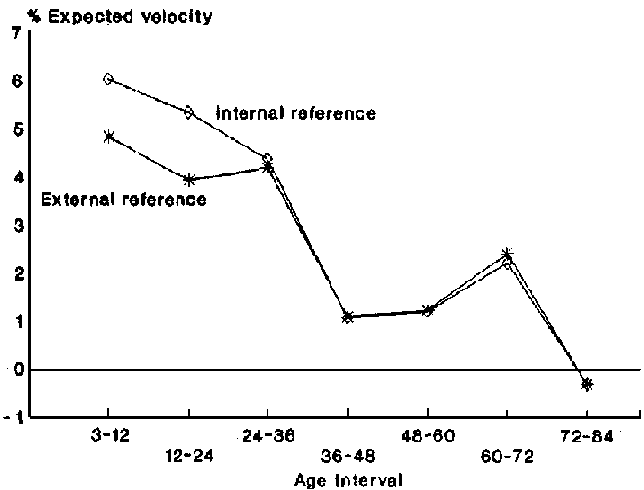
If percent of expected velocity compared with an external or internal reference is used as the dependent variable instead of actual velocity, again the pattern is similar (Figure 5). An extra 100 kcal/d of supplement was associated with about a 4-5% increase in expected velocity until the 24 - to 36-mo interval using the external reference and slightly higher using an internal reference. Very similar results were obtained if supplement is expressed per 10% of RDAs (not shown)
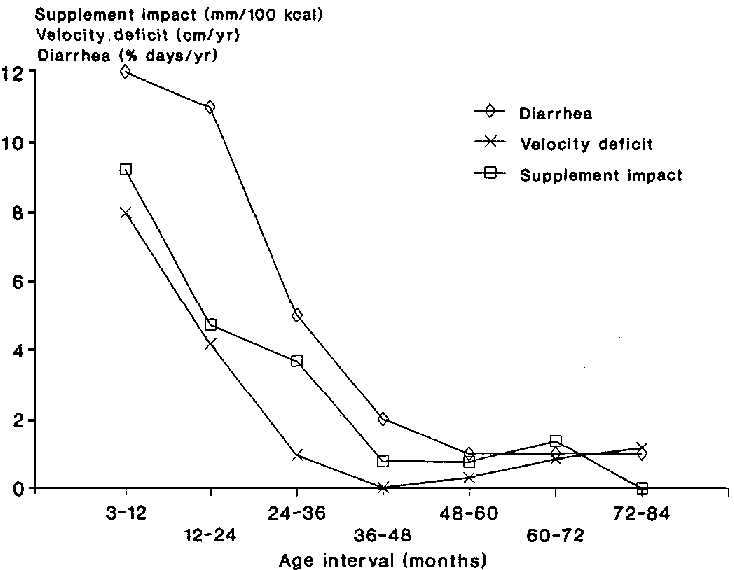
A summary figure (Figure 6) that superimposes the group mean of the percent of time spent with diarrhea, length velocity deficit for the Fresco children compared with an external reference (Baumgartner et al. 1986), and the parameter estimates of supplement intake (100 kcal/d or 418 kJ) on length gain during each of the intervals, demonstrates the close relationship between these factors and the impact of supplement.