Energy cost of pregnancy: change in diet-induced thermogenesis
Diet-induced thermogenesis (DIT) is the energy used for the digestion, absorption, transport, and metabolism of food, and the deposition of nutrients. In the non pregnant state, DIT is equivalent to about 10% of energy intake and a reduction in this component of energy expenditure could be one of the mechanisms by which women might save energy to meet the increased energy demands of pregnancy.
Two longitudinal studies have been published on changes in DIT in response to a standardised liquid meal during pregnancy. In one (Illingworth et al, 1987) a significantly lower effect ( - 28%) was observed in the second trimester compared to post partum, but not in the first and third trimesters ( - 1% and Ä15%, respectively). There are however a number of methodological problems with this study. In the other study (Spaaij et al, 1994b) DIT was virtually unchanged during pregnancy compared to pre-pregnancy baseline measurements. Changes relative to the pre-pregnancy value were - 1%, - 5% and -5% in weeks 13, 24 and 35 of gestation, respectively.
Prentice et al (1987, 1989) derived the energy costs of DIT plus minor physical movements from 24h energy expenditure measurements in a whole-body calorimeter. Over all measurement periods, the within-subject coefficient of variation was only 6%, equivalent to 0.8% of total expenditure, indicating that any changes in thermogenesis were biologically insignificant.. Schutz et al (1988) also determined longitudinal changes in DIT from respiration chamber measurements. Expressed as a percentage of energy intake, DIT was significantly lower during pregnancy (9 ± 1%) than NPNL (13.5 ± 1%).
Two cross-sectional studies of DIT have been published in which pregnant and non-pregnant women were compared. They show conflicting results. Nagy & King (1984) found no significant differences between six early-pregnant, four late-pregnant and six non-pregnant women, whereas Contaldo et al (1987) found DIT to be significantly lower ( - 35%) in five late-pregnant compared to five non-pregnant women. However, as a result of the large variability in DIT, the statistical power of such small cross-sectional studies is low.
We conclude that it is reasonable to assume that DIT remains essentially unaltered during pregnancy when expressed as a proportion of energy intake.
Energy cost of pregnancy: change in energy cost of activity
During pregnancy the energy cost of a given activity might increase as a result of body weight gain, especially if the activity involves movement of the whole body. The amount of energy expended under free-living conditions might also alter as a result of behavioural changes with respect to the type of activity, and in the pace or intensity at which it is carried out. We have reviewed the studies in which changes in the energy cost of non-weight-bearing (cycle ergometer exercise) and weight-bearing (treadmill exercise and step-test) activities were measured under laboratory conditions at a standard pace and/or intensity. Only studies which provided data on basal, resting or sleeping metabolic rates were included, so that the net cost of activity (gross energy cost minus BMR) and physical activity ratios (PAR, energy cost divided by BMR) could be determined.
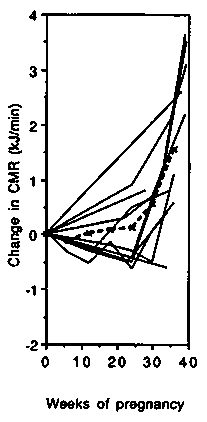
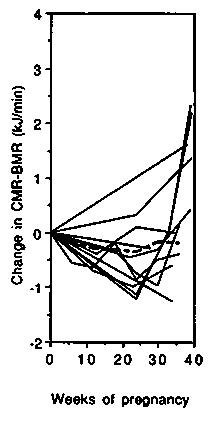
Energy cost of standardised non-weight-bearing activity. Changes in the energy cost of cycle ergometer exercise are presented in Figure 4. All studies were carried out in developed countries and all except two (Blackburn & Calloway, 1976; Seitchik, 1967) described longitudinal changes during pregnancy. The left-hand panel shows the changes in gross energy expenditure. Up to 35 weeks gestation, cycling metabolic rate (CMR) changed little compared to the baseline value (average 16.7kJ/ min or 4.0 kcal/min), and during the final 5 weeks most studies showed an increase (average + 1.9 kJ/min, +0.5 kcal/min or + 11.4%). The net cost of cycling was on average slightly below the non-pregnancy level up to 35 weeks (Figure 4, central panel) and only increased slightly above the non-pregnancy baseline from 35 to 40 weeks gestation, ( + 0.8 kJ/min, + 0.2 kcal/min or + 6%). The PAR progressively and almost linearly decreased during pregnancy (Figure 4, right-hand panel). The initial value averaged 4.0 and at the end of pregnancy had decreased by about 0.6 points or 15%. It appears that the change in CMR during pregnancy is not proportional to the change in BMR.
We conclude that the net cost of non-weight-bearing activity can be assumed to change little until very late in pregnancy when it increases by about 10%. The gross cost therefore tends to increase in line with changes in BMR. The PAR decreases in late pregnancy because the denominator (BMR) rises.
Energy cost of standardised weight-bearing activity. In Figure 5 the results of the six treadmill studies are summarised. Three were conducted in developed countries (Blackburn & Calloway, 1985; Durnin, 1991; van Raaij et al, 1990b) and three in developing countries (Heini et al, 1992; Poppitt et al, 1993; Thongprasert & Valyasevi, 1986). All studies except one (Heini et al, 1992) were longitudinal.
In developed countries despite the weight gained during pregnancy, the gross energy expended during treadmill walking (TMR, Figure 5 left-hand panel) was unchanged up to about 25 weeks gestation. Thereafter an increase was observed (average + 2.7 kJ/min, +0.6 kcal/min or +19%). The change in the net costs (Figure 5 central panel) was similar to that of the gross costs. The PAR was slightly reduced throughout gestation (Figure 5 right-hand panel) and by the end of pregnancy averaged 0.33 points (8.7%) below the baseline value.
In developing countries (Figure 5 left-hand panel) there was a much smaller increase in gross TMR by the end of pregnancy (0.6 kJ/min, 0.15 kcal/min or 7%). As observed in the developed countries, the results differed substantially averaging -0.7, + 1.0 and + 1.5 kJ/min ( 0.17, +0.25, +0.36 kcal/min or -8.4%, + 10.5% and +17.4%) in the studies by Poppitt et al (1993), Thongprasert et al (1987) and Heini et al (1992), respectively. There was virtually no change in the net costs (Figure 5 central panel). Near term, the average change relative to the baseline value was -0.4 kJ/min ( - 0.10 kcal/min) or -9.6% in the two longitudinal studies (Poppitt et al, 1993; Thongprasert et al, 1987). The PAR was slightly reduced during gestation (Figure 5 right-hand panel) and at the end of pregnancy averaged 0.32 points below the baseline value ( - 13.1%).
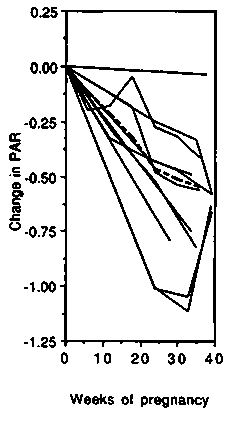
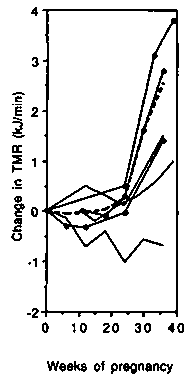
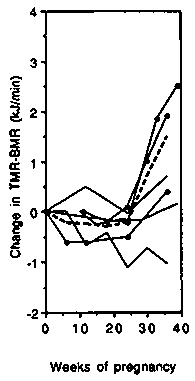
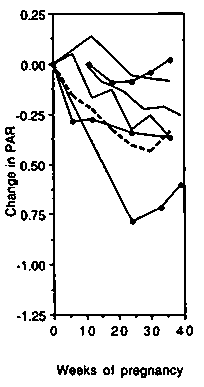
Prentice et al (1989) measured changes in the energy cost of another weight-bearing exercise: stepping on the spot up and down from a block (step test). The changes observed were similar to the average changes in the treadmill studies from developed countries.
We conclude that the net cost of walking stays fairly constant during the first half of pregnancy and then increases progressively to about 15% above the non pregnancy cost. The gross cost, which incorporates changes in BMR, increases by about 20% by term. As for non-weight-bearing exercise the PAR decreases due to the change in BMR.
One general comment should be made about expressing the cost of an activity as a PAR during pregnancy. PAR values describe the 'heaviness' of an activity and enable the intensity of different activities to be compared. This is so not only for NPNL, but also for pregnant women. However, the data presented above show that, when the intensity of an activity is kept constant, PARs decrease throughout pregnancy. This reduction at a fixed work output shows that PARs for non pregnant women should not be applied to pregnant women without modification.
Energy cost of self-paced activity. Two studies have examined changes in the energy expended on self-paced walking during pregnancy. In one study (van Raaij et al, 1990b) the measurements were made on a treadmill and walking pace was adjusted to the subjects' convenience. In the other study (Nagy & King, 1983) subjects carried a Douglas-bag on a back-pack frame when walking around a 400 m track. The pattern of changes observed in these two studies was totally different. van Raaij et al, observed a decrease in the net cost of self-paced walking (average -12%), and Nagy & King found an increase (average + 8%). Walking pace decreased by 4% and 12%, respectively.
We conclude that the net cost of self-paced walking increases during pregnancy if behavioural changes are limited, which is in line with the (more pronounced) increase of the net cost of fixed-pace walking. However, if women substantially reduce their walking pace during pregnancy, the net cost of the activity might decrease.
Changes in activity patterns (time-motion studies). In time-motion studies, the type and duration are recorded, categorising the activities in a way suitable for the habitual activity pattern of the population. As the activity categories differ, it is not possible to directly compare results between different studies.
Longitudinal time-motion studies have been carried out in two developed countries: Scotland (Durnin et al, 1987) and The Netherlands (van Raaij et al, 1990a). Activities were recorded by the subjects themselves during five consecutive days within each stage of pregnancy.
The Scottish women reduced the time they spent in bed during pregnancy ( - 30 min/day). At the end of pregnancy they spent more time sitting (+20 min/day) and less time walking ( - 30 min/day). There was no clear pattern of change in other activities with little indication that any marked diminution in activity occurred.
The Dutch women spent more time in bed (+70 min/ day), on very light sitting activities (+55 min/day) and on moderate household and walking activities (+25 min/day) during pregnancy. This was compensated for by spending less time on light and moderate sitting activities ( - 60 min/day) and on light standing activities ( - 90 min/day). In another Dutch study (Spaaij, 1993) women also spent more time in bed during pregnancy ( + 60 min/day).
In van Raaij's study an attempt was made to account for the combined effect of changes in both time allocation and in work intensity. Within each measurement period the energy cost of at least one activity from each category was measured. PALs were estimated by combining the energy expenditure results with the time allocated. At different stages of pregnancy, PAL was relatively constant (1.49-1.52) and the average during pregnancy (1.50) was only slightly below the value at 1 year post partum (1.53). The method has some clear drawbacks. Since the activities chosen for individual women were kept the same throughout the study there Ö was no accounting for changes in the choice of activities within each category. Furthermore it was assumed that the change in work intensity of the activity used for the measurement of energy expenditure was representative of the activities in each category.
In studies from developing countries, activities are not recorded by the subjects themselves, but by trained field assistants. In a longitudinal study conducted in Thailand (Thongprasert et al, 1987) women spent less time on childcare ( - 23 min/day), sitting, ( - 12 min/day), housework ( - 7 min/day) and walking ( - 6 min/day) and more time on agricultural tasks (+31 min/day) in late pregnancy compared to baseline estimates at 10 weeks gestation. Although there was a decrease in most activities, this was not compensated for by more time spent sleeping ( + 5 min/day).
In a longitudinal study conducted in The Philippines (Tuazon et al, 1987) activity diaries were only kept over 12 h and no real sleep/lying down/resting data was included. On average women spent more time sitting (+13 min/day), Iying down (+12 min/day) and on light housework (+17 min/day) during late pregnancy. This compensated for less time spent on moderate ( - 22 min/ day) and heavy housework ( - 26 min).
In The Gambia (Lawrence & Whitehead, 1988) women spent more time in bed during pregnancy (+30 min/day on field days and +60 min/day on home days) and less time on light/moderate housework ( - 40 min/day on both field and home days). However, on field days the duration of agricultural work (including walking to the fields) was not significantly affected by pregnancy and the major changes were decreases in the duration of household work ( - 20 min/ day) and walking around the village ( - 20 min/day). In another Gambian study (Roberts et al, 1982) activity was reported as total minutes/day spent on farmwork, housework, religious practices and walking. The times averaged 564 min/day at baseline (NPNL) and 493 min/ day when pregnant. Activity was generally lower during pregnancy than NPNL but peaked at four months and then decreased steadily to 407 min/day at nine months pregnant.
In a cross-sectional study conducted in Nepal (Panter-Brick, 1993), measurements were made over 12 h, so again there are no real sleep data. Pregnant women spent less time on outdoor activities including agricultural tasks ( - 23 min/day), husbandry ( - 22 min/day), forest work ( - 8 min/day), travel ( - 15 min/day) and rest ( - 5 min/day). This was compensated for by spending more time on indoor activities including domestic work (+34 min/day), family care (+10 min/ day) and rest ( + 41 min/day).
Durnin (1991) has pointed out that relatively small changes in activity patterns could result in significant energy savings. A calculated example shows that replacement of periods spent standing (60 min/day), on housework (30 min/day) and walking (30 min/day) by sitting; or by replacing sitting (60 min/day) by Iying down, could together result in an energy saving of about 700 kJ/day (165 kcal/day) or l95 MJ (45000 kcal) over the whole of pregnancy. However, the time-motion studies from developed countries do not show a consistent shift of time allocated to activity categories with high to those with lower energy costs. For example, both studies from The Netherlands showed an increase ( + 60 min) in the time spent in bed or Iying down, whereas the Scottish women reduced the time spent in bed ( - 30 min per day). Clearly, each category except 'Iying down' comprises a variety of activities, which could be performed at different intensities, and thus could involve a broad range of energy costs. During pregnancy, both the type and the intensity of activities within a category could change, resulting in energy savings without changes in the time allocated to different categories of activity. Therefore, although the longitudinal time motion studies presented above provide the best information available, they do not give conclusive data on how much energy is saved by changing activity patterns during pregnancy.
We conclude that it is reasonable to assume that about half the energy costs of pregnancy (i.e. about 0.6 MJ/day or 145 kcal/day) could theoretically be spared by reductions in the physical activity of the mother. However, it is difficult to uncover any patterns which could be described as typical pregnancy-induced behaviour. This emphasises that it cannot be assumed that a high proportion of energy costs of pregnancy are normally or automatically met by reductions in activity. The extent to which this occurs varies greatly among populations and individuals.
Energy cost of pregnancy: change in total energy expenditure
Total daily energy expenditure can be measured with whole-body calorimetry or the doubly-labelled water method. Studies using both methods are reviewed. Whole-body calorimetry allows detailed short-term measurements of 24 h energy expenditure (CalEE) and its components, but the respiration chamber is an artificial environment and the utilisation of strict protocols makes no allowance for behavioural changes. With the doubly-labelled water method the average total free living energy expenditure (TEE) can be measured over comparatively long periods of time (typically 10-21 days) without any hindrance to the subject.
Studies in which measurements of CalEE or TEE were carried out in combination with BMR measurements yield particularly useful data because energy expended on physical activity and thermogenesis can be calculated (CalEE-BMR or TEE-BMR). PALs can also be calculated from these data (CalEE/BMR or TEE/ BMR). BMR and RMR measurements are all referred to as BMR.
Respiration chamber studies. To date only five studies have been published in which assessments of changes in energy expenditure during pregnancy have been made by whole-body calorimetry. Three studies have been conducted in well-nourished Swiss (Schulz et al, 1988), British (Prentice et al, 1989) and Dutch (de Groot et al, 1994) women, two in marginally nourished women from The Gambia (Heini et al, 1992; Poppitt et al, 1993). The study by Heini et al, was cross-sectional. Calorimeter protocols differed between studies, but can all be classified as very sedentary.
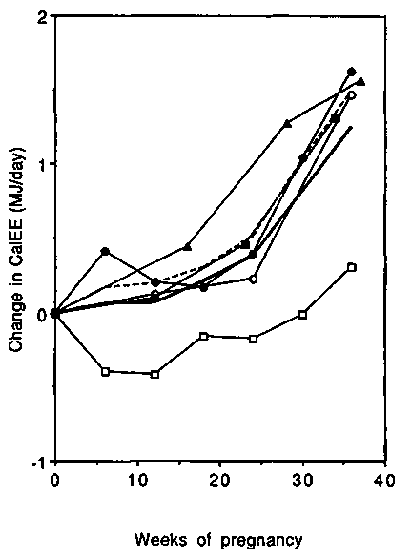
Because of the different protocols and subject characteristics it is not surprising that, expressed on an absolute basis, CalEE differed between studies. Initial values varied from 6.2 MJ/day or 1480 kcal/day (The Gambia; Poppitt et al, 1993) to 8.3 MJ/day or 1980 kcal/day (Switzerland; Schutz et al, 1988). Changes in CalEE during pregnancy are presented in Figure 6. Four studies demonstrated a very consistent pattern of changes during pregnancy (de Groot et al, 1994; Heini et al, 1992; Prentice et al, 1989; Schutz et al, 1988). Increases in CalEE averaged 0.18, 0.41 and 1.26 MJ/day (43, 98 and 301 kcal/day) in the first, second and third trimesters of pregnancy, respectively. However, in the longitudinal Gambian study (Poppitt et al, 1993), CalEE decreased slightly in the first and second trimesters, and in the third trimester only increased by 0.15 MJ/day (36 kcal/day). This study involved marginally nourished women, which might explain the discrepancy (see earlier discussion of BMRs). In contrast, the cross-sectional study (Heini et al, 1992), carried out in the same Gambian villages, showed a pattern of changes that was rather more similar to those found in developed countries. However, the difference in weight between late-pregnant and non-pregnant women in Heini's study was 11.8 kg, nearly twice the weight gain observed by Poppitt (6.8 kg), indicating that the groups probably had different non-pregnancy body weights, and hence, different baseline CalEE values.
CalEE-BMR showed only minor changes during pregnancy: two studies showing a small increase and two other studies a small decrease. Expressed in this way, the results of Poppitt et al, (1993) deviate to a much lesser extent from the average. Apparently, the changes in CalEE during pregnancy were caused largely by the change of BMR.
PALs were very constant fin two studies (Heini et al, 1992; Prentice et al, 1989) and a minor decrease was observed in the other two studies (de Groot et al, 1994; Poppitt et al, 1993). Doppler and actometer counts in de Groot's study confirmed that physical activity had somewhat decreased (Doppler counts - 6% and actometer counts - 17%).
We conclude that the CalEE of pregnant women increases steadily during pregnancy to a level about 1.5 MJ/day (360 kcal/day) higher than NPNL if activity remains constant. Most of this change is accounted for by the increase in BMR.
Doubly-labelled water studies. Six studies have reported measurements of TEE using the doubly-labelled water method. Four have been conducted in well-nourished women, from Britain (Goldberg et al, 1991; Goldberg et al, 1993), Sweden (Forsum et al, 1992) and the USA (Bronstein et al, in press) and two in marginally nourished women from The Gambia (Heini et al, 1991; Singh et al, 1989). Data from longitudinal studies (Forsum et al, 1992; Goldberg et al, 1991; Goldberg et al, 1993) and cross-sectional studies (Bronstein et al, in preparation; Heini et al, 1991, Singh et al, 1989) are presented together because of the small number of studies. All three longitudinal studies included pre-pregnancy baseline measurements.
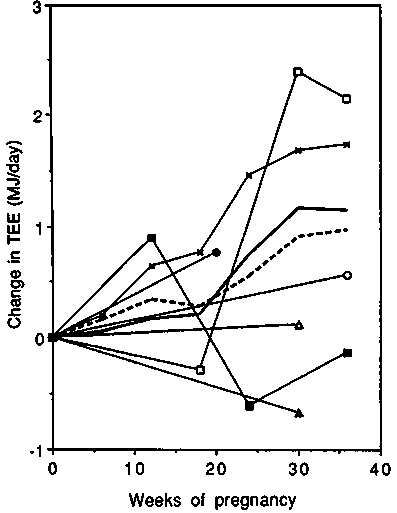
Average non-pregnancy TEE values varied from 9.1 MJ/day to 10.4 MJ/day (2170 to 2480 kcal/day) in all normal weight groups of women; however, the TEE of the obese women (Bronstein et al, in preparation) was considerably higher (12.1 MJ/day or 2890 kcal/day). Changes in TEE are presented in Figure 7. These were more variable than changes in CalEE because physical activity accounts for a substantial and highly variable part of energy expenditure in normal daily life, but not under respiration chamber conditions. Average changes during pregnancy in normal weight women from developed countries were 0.11, 0.47 and 1.15 MJ/day (26, 112 and 275 kcal/day) in the first, second and third trimesters, respectively, which compares surprisingly well with the changes observed in respiration chamber studies (0.18, 0.41 and 1.26 MJ/day). However, the late pregnant increase in TEE in both of the longitudinal studies with more than two measurements (Forsum et al, 1992; Goldberg et al, 1993) was about 2 MJ/day (480 kcal/day). This deviates substantially from the cross-sectional studies in which the average difference between late-pregnant and non-pregnant women was only 0.4 MJ/day or 95 kcal/day (Bronstein et al, in preparation; Heini et al, 1991, Singh et al, 1989). The TEE results of the two longitudinal studies were at variance if the mid-pregnancy period was considered.
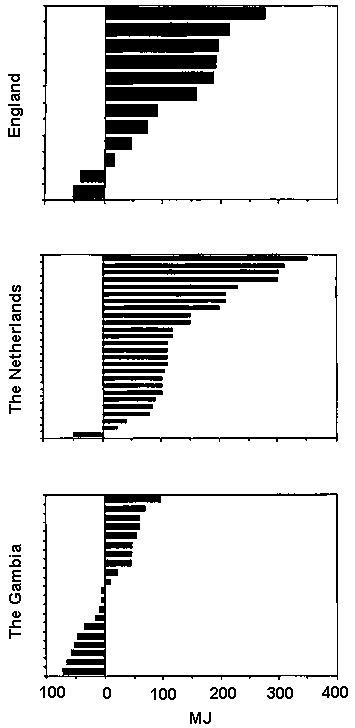
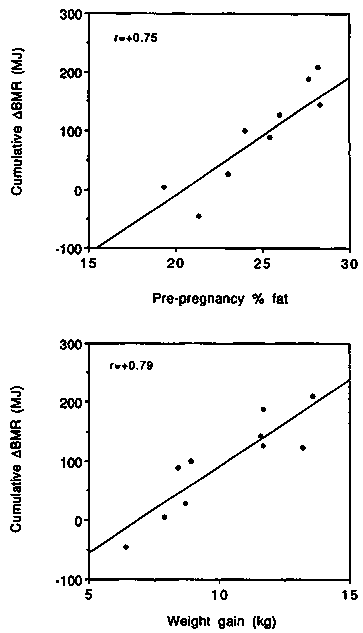
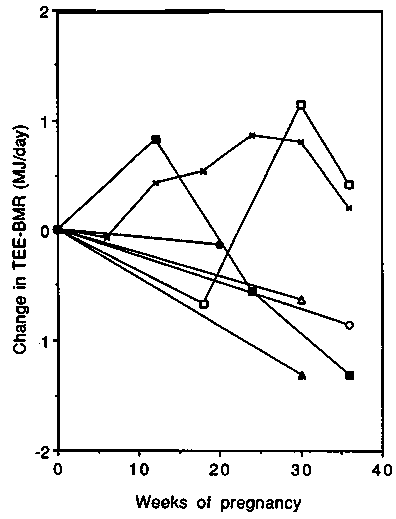
Changes in TEE-BMR are presented in Figure 8. It is apparent that changes in activity during pregnancy are highly variable between populations ranging between a reduction of - 1.2 MJ/day and an increase of + 1 MJ/ day ( 285 and + 240 kcal/day). The increases were observed in the two main longitudinal studies, and unchanged or decreased values in the cross-sectional studies.
High initial PALs (1.8 and 2.0) were observed in both Gambian studies (Heini et al, 1991; Singh et al, 1989) which agrees with the very active lifestyle of these women and the fact that measurements were made during the period of peak agricultural activity. The Swedish women, who the authors stated were 'professionally active', also had a high initial PAL (1.80) (Forsum et al, 1992). In the English and American studies (Bronstein et al, in preparation; Goldberg et al, 1991; Goldberg et al, 1993) the average non-pregnant PAL ranged between 1.58 and 1.66.
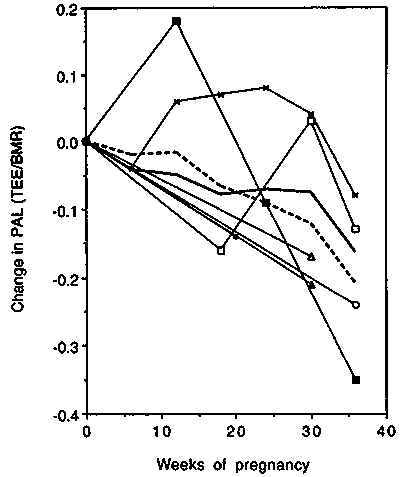
The cross-sectional studies generally found lower PAL values in pregnant vs non-pregnant women (Figure 9). In the longitudinal studies PALs at the end of pregnancy were below the pre-pregnancy baseline; in mid-pregnancy however, either an increase (Goldberg et al, 1993) or a decrease (Forsum et al, 1992) was observed.
We conclude that on average doubly-labelled water studies indicate very similar increases in TEE to those recorded in calorimeters (up to about + 1 MJ/day or +240 kcal/day towards term). There is a large variability between studies all of which have rather small samples. The two longitudinal studies show the largest increases (up to about + 2 MJ/day towards term). These new findings must be considered when trying to resolve the high requirements/low intake paradox. A steady decrease in PAL can be assumed to occur in affluent women as pregnancy progresses (to about --0.15 units at term). Note the PAL would decrease even if activity remained constant because the denominator (BMR) increases in pregnancy. If a PAL × BMR system is adopted for pregnancy, this observed decrease can be cited as the likely behaviour of well-nourished women. It will have to be stressed however that many women may not be able to decrease activity.
Energy supply during pregnancy: changes in energy intake
A substantial amount of data has been collected on changes in energy intake (EI) during pregnancy. The general observation is that the incremental intake during pregnancy does not meet the energy needs. In this section, eleven studies in which changes in EI were studied longitudinally during pregnancy are reviewed and critically re-examined. Studies were included if they described three or more stages of pregnancy relative to baseline.
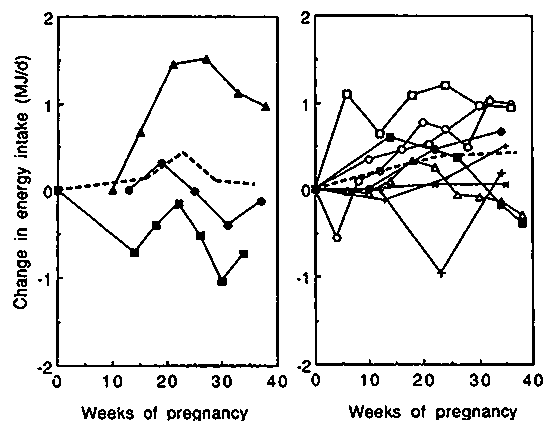
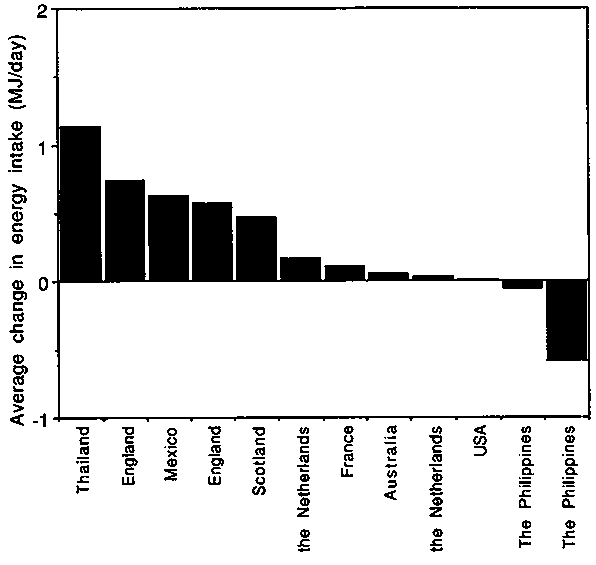
Changes in EI during pregnancy are shown in Figure 10. Studies with average birthweights <3kg (left-hand panel) are presented separately from those with more favourable average birthweights (right-hand panel). The observed average changes in EI during pregnancy varied dramatically. As shown in Figure 11, cumulative values ranged from - 0.59 MJ/day ( - 140 kcal/day) in The Phillippines, (Barba, 1994) to + 1.13 MJ/day (+270 kcal/day) in Thailand, (Thongprasert et al, 1987). In populations with average birthweights >3kg, the average increase in EI was 0.14, 0.38 and 0.42 MJ/day (33, 91 and 100 kcal/day) in the three trimesters of pregnancy, or on average only 0.31 MJ/day (74 kcal/day) over the whole of pregnancy.
It can be concluded that the reported EI of well nourished women shows a surprisingly small increase during pregnancy.
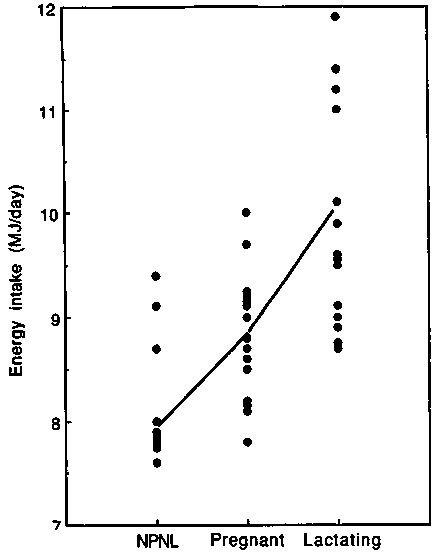
Discrepancy between longitudinal and cross-sectional studies. Figure 12 summarises data on measured EI in groups of pregnant European, North American and Australian women, assumed to be eating to appetite. From cross-sectional comparisons, the average EI of pregnant women appears to be about 0.9 MJ/day (210 kcal/day) higher than those of NPNL women. This increase is substantially larger than observed in the longitudinal studies. The discrepancy implies that estimates from cross sectional studies are too high or estimates from longitudinal studies are too low. However, the cross-sectional comparison provides only a very crude estimate of changes in EI during pregnancy. An overestimation in the cross-sectional comparison could be caused by differences in EI estimates provided by populations of NPNL and pregnant women, but there is no reason to predict any particular directional bias from this source. However, the possibility of underestimation with longitudinal comparisons should also be considered.
Estimated changes in EI from longitudinal studies could be too low, if the simple fact of repeating the measurement affects the degree of under-reporting (for instance due to decreasing compliance as subjects tire of the procedure). This possibility was evaluated in two different ways: firstly studies which included post-lactational baseline measurements were compared with those which included pre-pregnancy baseline measurements; secondly, to test for decreasing compliance, repeated EI measurements in NPNL subjects were reviewed.
All the longitudinal studies presented in Figures 10 and 11 had pre-pregnancy or early-pregnancy baseline measurements. Such studies would provide too low estimated changes in intake, if under-reporting increased when the measurements were repeated: however, the same shift in validity would result in an over-estimation of changes in energy intake if post-lactational estimates were used as the 'baselines'.
Black et al, (1986) studied EI during pregnancy relative to a post-lactation baseline (3 months after weaning) in 46 women. EI averaged 8.8 MJ/day (2100 kcal/day) during the third trimester and 7.9 MJ/ day (1890 kcal/day) post-lactation. The average pregnancy value was 0.7 MJ/day (170 kcal/day) higher than the baseline. This is larger than the difference observed in the studies with pre-pregnancy baseline measurements (0.3 MJ/day) and supports the possibility of increasing under-reporting when repeating the measurement. However, as mentioned by the authors, dieting behaviour might also have caused the relatively low EI in the post-lactation period.
Goldberg et al (1991) found that the EI of ten women was 0.4 MJ/day (95 kcal/day) higher at 36 weeks gestation (9.8 MJ/day or 2340 kcal/day) than post partum (3 months after weaning) (9.4 MJ/day or 2245 kcal/day). This increase is identical to the average third trimester increase observed in studies with a pre-pregnancy baseline measurement.
King et al (1972), measured the EI of 14 to 17-year-old adolescents at 32 weeks gestation (7.8 MJ/day or 1860 kcal/day) and after delivery (7.0 MJ/day or 1670 kcal/day). The difference between the third trimester measurement and the post-partum baseline value (0.8 MJ/day or 190 kcal/day) is larger than the average difference in studies with pre-pregnancy baseline values, but adolescents may have a greater inherent need to increase their intake.
These studies provide little support for the contention that the low intakes observed during pregnancy may be due to measurement fatigue. At most this might be responsible for an error of about 0.2 MJ/day (48 kcal/ day) (derived by comparing the 0.8 MJ/day increment from the Black and King studies with the 0.4 MJ/day increment summarised above).
The possibility of increasing under-reporting when repeating EI measurements, was also evaluated using studies of repeated measurements of EI in NPNL subjects. Only studies in which measurements were repeated within 6 months were considered of interest.
Repeating 3- to 7-day weighed records resulted in a decrease of estimated EI in six studies, and in an increase in three studies. The weighted average of the change in EI relative to the baseline was - 0.2 MJ/day. Repeating 24-h recalls or food frequency questionnaires showed a decrease in estimated EI in three out of four studies. The weighted average of the change relative to the baseline was also - 0.2 MJ/day.
We conclude that there is reasonable evidence to suggest that the 0.3 MJ/day increment in EI observed in longitudinal dietary studies may underestimate the true change, but only by about 0.2 MJ/day. Over the whole of pregnancy this would raise the extra energy intake from 84 MJ to 140 MJ (20 000 to 33 500 kcal).