BMR can be accurately
measured by direct or indirect calorimetry, but it is simpler, in
practice, to use predictive equations. By 1951, a plethora of
equations to predict BMR were in existence, some easier to use
than others. The predictive equations of Aub & Du Bois (1917)
tended to over-estimate BMR, as the subjects measured by these
authors were under thermal stress and anxious. In contrast,
Robertson & Reid's equations (1952) underestimated BMR, as
they were based on the lowest recorded values of metabolic rate.
Finally, while Quenouille's analysis (Quenouille et al,
1951) was comprehensive, the equations were too complicated to be
of routine practical use. Recently Schofield (1985), published
predictive equations that were used for the FAO/WHO/UNU report
(1985) and thereby became the basis for estimating energy
requirements in man.
The Schofield analysis and equations, based on a database of 114 published studies of BMR, representing 7173 data points, is the largest and most comprehensive analysis of BMR to date. While the Schofield equations predict BMR accurately in many individuals from temperate climates, they seem to be less accurate in predicting BMR in populations in the tropics (Henry & Rees, 1991; Piers & Shetty, 1993) and North America (Clark & Hoffer, 1991) and appear to over-estimate BMR in many populations (Piers & Shetty, 1993; Soares, Francis & Shetty, 1993; Hayter & Henry, 1993).
Table 6 List of Italian subjects used in the database of Schofield
Study |
n |
Sex |
Age |
Subject details |
Pepe & Rinaldi (1936) |
217 |
M |
6-16 |
None provided |
143 |
F |
5-12 |
None provided |
|
Pepe & Perrelli (1937) |
257 |
M |
5-16 |
None provided |
235 |
F |
5-12 |
None provided |
|
Felloni (1936) |
532 |
M |
19-25 |
Students of the Royal Fascist
Academy |
Lafralla (1937) |
213 |
M |
14-20 |
Students of Naples Royal Military
College |
Lenti (1937) |
525 |
M |
20-25 |
Military Servicemen |
Pepe (1938) |
252 |
M |
18-24 |
Students of Royal Naval Academy |
Occhiolo & Pepe (1939) |
247 |
F |
20-67 |
Various social groups |
Occhiulo & Pepe (1940) |
571 |
M |
22-54 |
Police officers |
Granall & Busca (1941-1942) |
186 |
M |
16-55 |
Labourers and miners |
Total |
3370 |
All references in Schofield, Schofield & James (1985).
There are several reasons to suggest that there is a need to re-analyse the worldwide data on BMR using stringent inclusion criteria in order to generate more valid equations to predict BMR in humans worldwide.
(1) Schofield collected data for his study a decade ago. Since then several laboratories have produced a large number of good quality BMR data for different age, sex and ethnic groups that also need to be included.
(2) Henry & Rees (1988) have identified over 1500 data points for Caucasian subjects in the old literature that meet all the strict criteria used by Schofield, but were not included; these values also need to be incorporated.
(3) Certain age groups (children and adults over 60) are under-represented, and these parts of the database need to be expanded in order to generate more reliable predictive equations for those age ranges.
(4) Close examination of the Schofield database (Table 6) shows that of the approximately 6000 BMR values for males between 10-60 years, over 3000 (50%) come from Italian military subjects. The validity of including such a disproportionate number of Italian military subjects may need to be queried, firstly, because the Italian group appears to have a higher BMR per kg than any other Caucasian group (Hayter & Henry, 1993), and secondly, because they may not be representative of the general Italian population. In fact Schofield (1985) noted that when Italians were isolated from the rest of the sample and compared with the derived BMR predictive equation there was a significant lack of fit. The inclusion of this disproportionately large Italian group with a higher BMR per kg may have artificially elevated the predictive equations generated by Schofield.
(5) If an analysis of the BMRs of people from the tropics and sub-tropics (Henry & Rees, 1991) points to a lower BMR than predicted by the Schofield equations, this may be due mainly to the bias imposed by the dominance of the Italian data. More recent data in fact support the view that BMRs of people in the tropics are not different from those in temperate regions (North America and Europe), provided the subjects are well nourished (Henry et al, 1987; Hayter, 1992; Soares, Francis & Shetty, 1993; Piers & Shetty, 1993).
There is thus mounting evidence to suggest that the Schofield equations may be overestimating BMR in many populations, leading to an over-estimation of their energy requirements. This has both practical and political implications. In the light of this, a critical reassessment of the worldwide data on BMR is required.


In addition to the
observation that the Italian data revealed a higher BMR/kg,
Quenouille et al (1951) and subsequently Schofield et
al (1985) noted that Asiatic subjects (Indians and Chinese)
had a BMR 10-12% lower than Europeans. Indeed such a claim for a
lower BMR in Indians had first been reported by Mukerjee &
Gupta (1931) and Krishnan & Vareed (1932). Extending the
observations reported by Schofield et al (1985), Henry
& Rees (1988; 1991) showed that the BMR was 8-10% lower in a
range of other tropical residents (Filipino, Indian, Japanese,
Brazilian, Chinese, Malay and Javanese) as well. In contrast to
these earlier reports of low BMR in tropical peoples, recent
studies have shown no difference in BMR between Indians and
Europeans (Henry, Piggott & Emery 1987; Hayter 1992; Soares,
Francis & Shetty, 1993).
Table 7 Recent studies of basal metabolic rate in male migrants from tropical to temperate climate
Study |
Subjects |
n |
Age |
Height (m) |
Weight (kg) |
kJ/kg/d |
|
DeBoer et al (1988) |
African |
8 |
31 |
1.71 |
69.9 |
91 |
SMR |
European |
7 |
30 |
1.84 |
78.4 |
87 |
SMR |
|
Chinese |
7 |
33 |
1.67* |
62.5* |
98* |
SMR |
|
Indian |
8 |
26 |
1.72* |
58.9* |
98* |
SMR |
|
Henry et al (1987) |
Asian |
11 |
21 |
1.63 |
56.2 |
115 |
RMR |
British |
11 |
25 |
1.68 |
57.4 |
108 |
RMR |
|
Ulijaszek & Strickland (1991) |
Gurkhas |
17 |
25 |
1.67** |
67.1 |
105 |
BMR |
British |
17 |
23 |
1.73 |
66.8 |
110 |
BMR |
|
Geissler & Aldouri (1985) |
British |
15 |
25 |
1.74 |
68.1 |
117 |
RMR |
Asian |
15 |
27 |
1.68 |
63.9 |
107*** |
RMR |
|
African |
15 |
28 |
1.71 |
67.1 |
101*** |
RMR |
|
Blackwell et al (1985) |
American |
8 |
31 |
1.75 |
75.0 |
93 |
SMR |
Asian |
8 |
25 |
1.66* |
53.0* |
108 |
SMR |
|
Dieng et al (1980) |
W. African |
10 |
34 |
? |
73.0 |
115 |
RMR |
French |
10 |
36 |
? |
75.0 |
111 |
RMR |
|
Hayter & Henry (1993) |
Trop 1 |
9 |
23 |
1.70 |
63.8 |
113 |
RMR |
Temp 1 |
9 |
25 |
1.76 |
67.5 |
114 |
RMR |
|
Trop 2 |
21 |
25 |
1.69 |
58.2 |
118 |
RMR |
|
Temp 2 |
20 |
23 |
1.77 |
68.3 |
114 |
RMR |
|
Significantly lower with *P < 0.05, **P < 0.01, ***P < 0.005, by the statistical test used in the referred papers. SMR = sleeping metabolic rate, RMR = resting metabolic rate, as specified in the cited papers, expressed in kJ/kg/day. Trop (1 & 2) = two groups of tropical migrants, Temp (1 & 2) = two groups of temperate climate residents. All references in Hayter & Henry (1993).
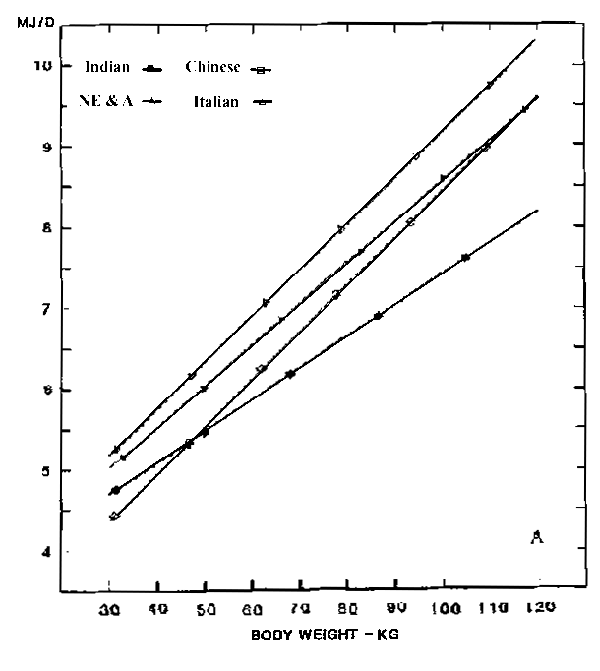
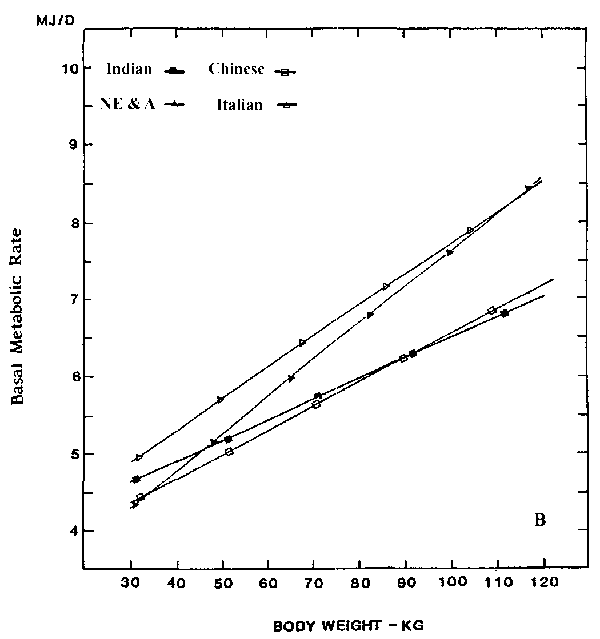
One approach to studying this problem is to compare the BMR in different population subgroups at similar body weights, thus eliminating a major source of variance in BMR associated with body weight. BMR predictive equations, generated for different population groups over defined body weight ranges, can then be used for comparison. To achieve this, the databases of Schofield et al (1985) and Henry & Rees (1988), were combined and used for analysis (Hayter & Henry, 1993). The resultant data set contained 7737 individual measurements of body weight, height, sex, age and the geographical origin of subjects. The 18-30 year age group was considered most suitable for detailed analysis, as it had a BMR database of 2999 males and 874 females. This age range also showed a negligible effect of age on BMR. Sub samples of Indians (210 males and 137 females), Chinese (200 males and 122 females), North Americans/North Europeans (478 males and 372 females) and Italians (169 males and 135 females) were available for analysis.
The linear
least square regression lines of BMR on body weight of those from
ethnic subsamples for both sexes are presented in Figure 1.
Italian males and females, who comprised 45% of the Schofield
database, turn out to be again the most divergent group. The
apparently elevated BMR of Italians and their numerical dominance
in the sample appear to bias the predictive equations. This may
explain why the BMR of Indians and other tropical populations is
overestimated by the Schofield equations.
An analysis of the
available literature on the effects of recent migration (over 2-4
weeks) from the tropics to temperate zones, and of follow-ups
till 9 months later, shows that there are no differences of any
significance between the BMRs per kg body weight of tropical
migrants and those of their peers born and resident in temperate
zones, provided the subjects are from privileged backgrounds and
well-nourished (Table 7). There is thus no reason to believe the
BMRs of well-nourished tropical individuals are lower than those
of European or North American subjects.